
Holland Energy Prize: Biggest Loser Challenge 2016 Final Report
Residents of the City of Holland proper were invited to participate in a yearlong challenge that encouraged them to reduce their electric, gas and water usage in the year 2016 compared to their previous usage in 2015. Their incentive to win included
various prizes ranging from $25 – $250.00 and a $500.00 check for the overall “biggest loser” that reduced their energy the most compared to their usage in 2015. We also encouraged people to receive and improve their DOE Home Energy Score (HES) by giving $250.00 for the biggest improvement.
Categories include
First, second and third place in most energy (gas + electric), electric, gas and water usage reduced in 2016 compared to 2015.
First, second and third place for most improved Department of Energy Home Energy Score Least energy and water used by all participants.![]()
We also had various door prizes available during the awards ceremony ranging in $5 – $50.00 value.
Multiple residences won more than one of categories but to ensure more people at the event we made it, so only one person got one award.
SEMCO and Holland Board of Public Works provided GHI with electric, gas and water data for those who signed a utility release (required to enter) for the entire year of 2015, midway through 2016 and in 2017 for the entire year of 2016. For that small amount of homes who did not have a full year worth of data in 2016, their numbers are based on city averages. Updates were given out in 2016 to show how far along people were.
Who participated?
We initially had 130 people sign up, but due to not being in the city or moving during the challenge, we had 118 finalists. Individuals registered but their entire household was responsible for participating.
Winners
· Biggest Loser – $500 Robert Jasinski – 36% reduction in energy
· Most Improved DOE Home Energy Score – $250.00 Sandra Keirnan 4 to an 8
(out of 10)
· first place GAS Jeff & Jill Raywood 56%
· first place electric Hope Olson 64%
· first place water Robert Williams 47%
· second Place Energy Sandra Vanderploeg 32%
· second place GAS Joanne Paul 36%
· second place electric Gene Zoerhof 43%
· second place water Tabitha Wolters 41%
· second Most Improved DOE Home Energy Score Aaron Keller 3 to 6
· third place ENERGY Melanie Scott 26%
· third place GAS Joseph Arevalo 31%
· third place electric Joel DeYong 27%
· third place water Stephen Haden 39%
· 3rd DOE HES Tied – Jeff Beird and Tim Evans Increase by 1
How was it promoted?
The City of Holland and Holland BPW were already well underway in their Community Energy Plan and Georgetown Energy Prize Competition. This initial momentum through citizen engagement that manifested as ward competitions, living sustainable along the lakeshore events, an energy financing pilot and a 2015 home energy labeling pilot (conducted by GHI on 50 homes)* along with an early 2016 door-knocking campaign, gave us the ability to reach people to encourage them to register. GHI conducted some Facebook targeted ads with minimal success.
*http://www.cityofholland.com/sustainability/reps-energy-scores-and-reports
What education was involved?
Initially, GHI offered four “Introduction to the Home Energy Efficiency Pyramid” Courses both in person and one online in the city of Holland. We attracted 50 people to these events to help them understand how energy works in a home, what are the easiest, cheapest and most DIY ways to reduce energy vs. those that cost more, require skilled labor but save the most energy in the long term. We also discussed incentives, rebates, and opportunities for the looming on-bill financing that is now available. During these sessions, people were invited to sign up for the challenge as well.
We also broke down the introduction to Home Energy Efficiency Pyramid course along with many other resources, tips, and tricks and sent out weekly to biweekly newsletters to homeowners in the challenge to give them bite-sized recommendations on what to do in their homes. We referenced much technical information from many green building blogs and websites but put it into bite-sized information for participants. All of this archived for the public online*. On top of that, we invited every participant to join a closed (now open) Facebook user group where we shared daily to weekly updates on tips and tricks to win, many coming from The Dept of Energy (DOE), the Home Energy Saver, Green Builder Advisor and Green Home Guide. We also encouraged everyone to share what they are doing, and it was a great outlet for sponsors.
Both through the City of Holland and Efficiency United, Sixty-one participants had assessments. The audits were given out on a first-come, first serve basis. Auditors conducted a formal Dept of Energy Home Energy Score assessment (we will discuss this later), but also the auditors were encouraged to use this as a one on one education session on how the homeowners can make improvements to their home, who can help them do it and how to fund it. GHI would follow up with each homeowner behind the scenes helping them make better decisions and answering technical questions.
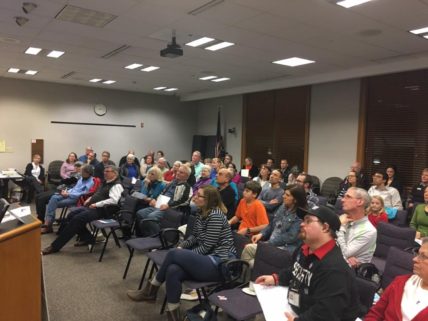
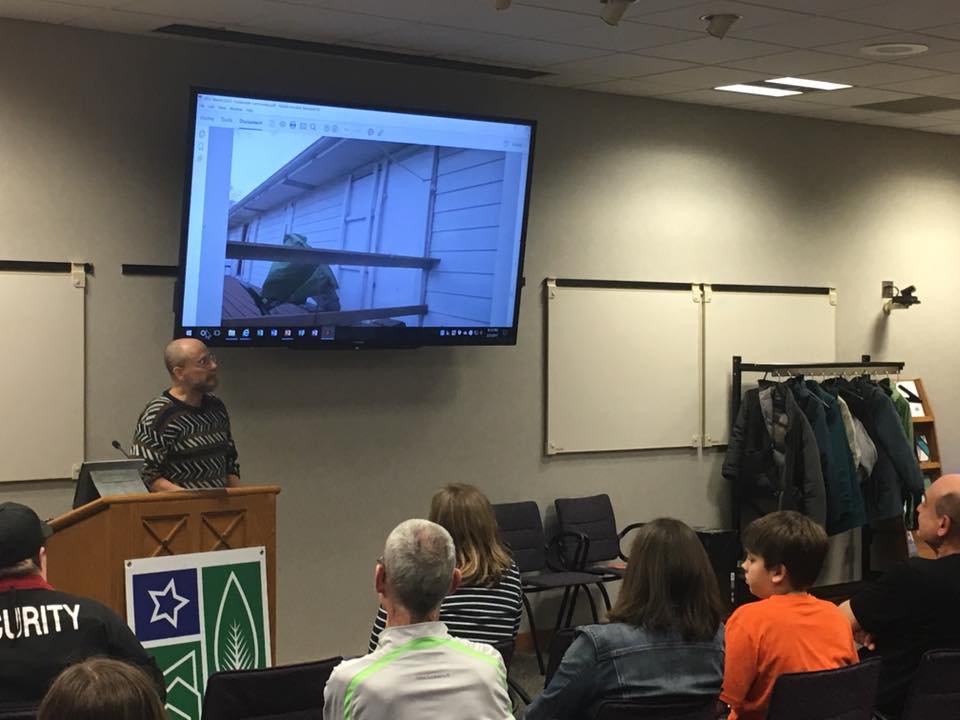
To wrap up the program we partnered with the Lakeshore Sustainability Series where we covered topics on the Holland community resilience plan as well as updates on the community energy plan and details on how to use the on-bill financing and 20% rebate in the City. The event culminated with each of the losers coming to receive their awards and share their stories on what they did to reduce energy and water. The biggest loser was given 5 minutes to do a short presentation showing all the strategies they use to save energy and win. Everyone got to hear from winners in the community on how he or she won through shared stories, laughter and insight. We captured the entire awards session film, and it is available to watch on our Youtube channel here.
What were the results?
118 Participates and of which 61 received DOE Home Energy Score. In regards to the data presented here, we only tracked homes with an actual full year’s’ worth of usage, so these data points only include 105 homes of which 47 received home Energy Scores with an average of a 10% reduction energy usage.
Overall we had 9.76% reduction in energy usage which was made up of a 12.68 reduction in gas usage but also included a 2.17% increase in electrical usage. Water use on average increased by 3.75%.
Home Details
Average Square Feet 1661
Biggest house 4095
Smallest house 728
Average Home Age 1951
Details of Homes with Scores
% of Homes with AC 83%
Average # of Bedrooms 3.5
Average # of Stories 1.6
Average Conditioned square feet 2159
Average Air Leakage Rate @ CFM 50 2729
Leakiest Home 5980
Tightest Home 1225
# of homes professionally air sealed? 2
Average Fuel efficiency of heater (AFUE) 0.82
Average Cooling efficiency was (SEER) 11
Average Water Heater Energy Factor (EF) 0.58
Homes with foundation wall insulation? 21%
Who supported it?
The City of Holland, Holland Energy Fund, SEMCO Gas, Clearesult, Efficiency United, Holland Board of Public Works, Sustainability Institute, GreenFit Homes, West Michigan Glass Block. Home energy scores were completed by the GreenHome
Institute Green Building Programs Manager and by David Meeder of Custom Home Energy Services.
Notable Sponsors Include
Baumann & Degroot – Free Humidifier + Install Panasonic
– 3 Free Whispergreen Bath Fans
Niagara Conservation – 3 Free water efficiency kits & Stealth .8 GPF Toilets Home
Depot Grand Haven – 1 Leaf blower & $50s in gift cards
The Georgia Pear – $200.00 in-home interior design consultation
Local First of West Michigan – $160 – 2 tickets to fork fest Schreur
Printing – $500.00 in free event marketing mailings
What is the DOE Home Energy Score?
In 2014 GHI was charged with finding a label that can be used on all homes in Holland to help standardize and communicate energy efficiency. We knew the RESENT Home Energy Rating System (HERS index rating) was too expensive, time-consuming and not as accurate when used on existing homes. In 2015 we piloted the Cake System’s Energy Performance Score (EPS) but ultimately decided to switch to the Dept of Energy Home Energy Score because it is affordability, accuracy, marketability, ease of use and government backing. Homeowners who received a score did 5% better in reducing gas energy, and that score itself was 97% accurate in predicting energy usage in comparison to actual utility data. A full spreadsheet of our research is available for download here.
Score details
“Imagine you are in the market to buy a car and comparing your options. You are weighing some factors in your purchasing decision, including performance, cost, size, and appearance. When you ask the salesperson what the miles-per-gallon rating for each car is, they shrug and say, “I do not know.” Even if fuel efficiency is not the only factor you are considering, this would probably concern you as a prospective buyer.
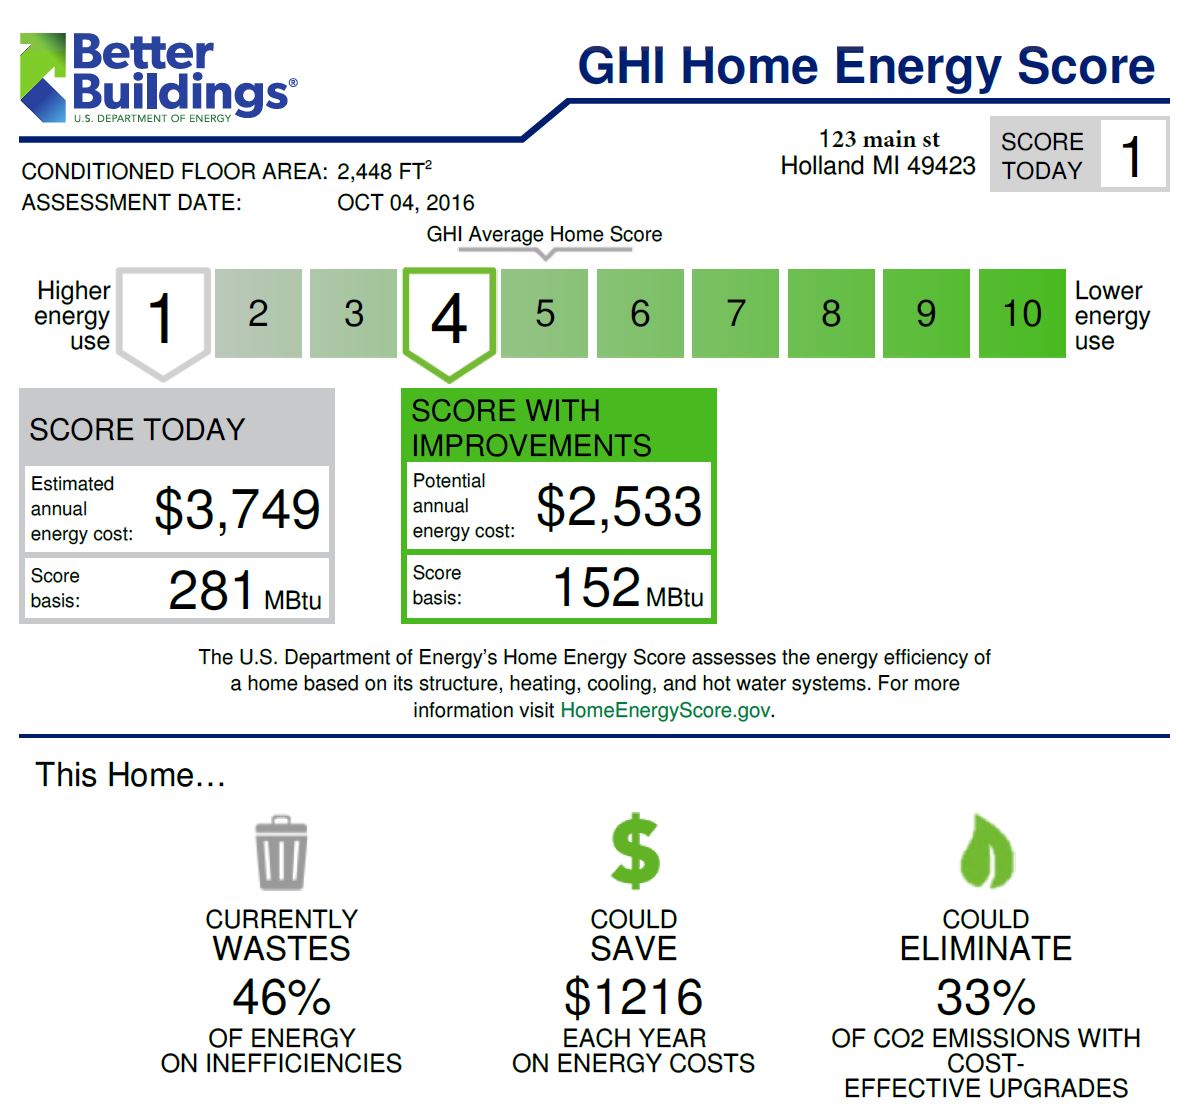
Moreover, yet, this is how most people make decisions when buying or renting a home: without any information about how much energy the home is expected to use, how much this will cost them, or how to cost-effectively lower energy expenses. Like a miles- per gallon rating for a car, the Home Energy Score is an easy-to-produce rating designed to help homeowners and homebuyers gain useful information about a home’s energy performance. Based on an in-home assessment that can be completed in less than an hour, the Home Energy Score not only lets a homeowner understand how efficient the home is and how it compares to others, but also provides recommendations on how to cost-effectively improve the home’s energy efficiency.
Features of the Home Energy Score
An energy efficiency score based on the home’s envelope (foundation, roof, walls, insulation, windows) and heating, cooling, and hot water systems)
A total energy use estimate, as well as estimates by fuel type assuming standard operating conditions and occupant behavior
Recommendations for cost-effective improvements and associated annual cost savings estimates
A “Score with Improvements” reflecting the home’s expected score if cost-effective
improvements are implemented
Information in italics is taken directly from the better buildings website
More details on the score and an example of an audited home can be found here.
What role did the score play in the challenge?
The score was used as an incentive to get homeowners to sign up. City & Gas Utility funded scores were given out on a first come, first serve basis, at no cost to the homeowners. The score assessment process was used as an educational opportunity as detailed above and as a means to win by encouraging people to increase it during the year, thus require structure efficiency improvements.
Outcomes
Our original goal was to reach 250 people in Holland but only firmly got half that number to sign up and some of them did not qualify to bring it down to 118 total. We believe this could have been due to a large number of choices and alternative programs in Holland area and that early adopters participating in these may have signed for as many events and programs as they had time for. The real challenge in the City will be to reach those not connected or involved in city events. After normalizing our data for weather differences between 2015 & 2016, we achieved our original goal of 10% reduction in energy, but we were a little surprised to see both water and electrical usage slightly rise. Most of the savings were in gas energy which makes sense because in our region most hot water and furnaces are gas powered. For electricity, many of the items that save energy very inexpensively like unplugging electronics and switch to all LED’s were already done by many people in the competition
and with the national trend of more and more electronics used in homes, it seems there is no surprise electric usage would slightly rise. As far as water usage rising, we attempted to determine if there were long periods without rainfall in 16 vs. 15 but
couldn’t find any significant data.
We are very surprised by the financial support we received both by local and national businesses who first and foremost reiterated that this program was a great idea and then gave contributions of good and services for our program.
During this competition, we also took the time to study the value of the Department of Energy Home Energy Score because many scores and labels tend to over-predicting energy savings and not accurately predict energy usage. There are many factors that influence energy usage in a person home. Occupancy, behavior and weather patterns are a few that can impact usage. We had the 2015 real utility usage in 47 of the competitor’s homes scored and the predictions made by the Home Energy Score tool
was 97% accurate through only over predicting usage by 3%. While more studies on accuracy with a larger sample size would be needed, this is a clear positive sign of the tool’s value. Being able to quickly, cheaply but more accurately assess a home’s energy
usage while giving the homeowner a clear path to improve, is important to get tangible reduction results.
Replication
These types of challenges could be replicated at city, township, village or even county levels. They may apply to state-based programs, but that could reduce some of the community buy-in. It does help when there are overarching goals of energy reduction challenges that include the resident’s homes and when it is driven and marketed by the municipality. While having energy efficiency incentives, rebates or other unique financings can be beneficial; it is not the main driver. National and local sponsors also are very supportive of these types of events and could be utilized in other areas that want to host competitions. Have utility company participate and on board from the beginning is important to ensure accurate utility data is collected and as a promotional partner. It also may make sense to shorten the reporting period to 4 – 6 months over the course of the winter (in cold weather climates) where most energy is being used. This is where a majority of homes can see an improvement while also keeping people interested as a year tends to cause some people lose interest during that duration. GHI hopes to expand
more of these competitions in many of the areas we work.
How much did it cost to deliver?
The Holland Energy Fund paid in total $13,675.00 for the following components:
$2,550: Awards Event which included prizes, awards, catering, and marketing for the
event. Sponsors covered half of the cost of the prizes.
$4,525 for program administration and educational events
$6,600 for fifty (50) residential energy audits and Home Energy Scores
Report By:
Brett Little
Executive Director
GreenHome Institute / Home Energy Score Partner
GreenHomeInstitute.org
Watch a 1 hour presentation on this report and get CEUs.