[xoo_el_action type="login" display="button" text="Login / Sign Up" change_to="logout" redirect_to="same"]
Categories
Q&A Webinar After

Saving Water Using EPA’s WaterSense Outdoor Water Budget Tool V2.0 Article & Q&A

Holly Cannon and Sarah LaVoy joined us recently for our  Weekly Wednesday Free CEU webinar Series.

If you missed this session, want to rewatch it, or share it with a friend or colleague, you can now do so, as the recording and article on the topic are available below. 

Note: In the webinar, we stated this could be used for LEED Residential water performance, but after additional review, it was determined that this cannot be used at this time, and you must continue to use version 1 for the time being. 

Overall, respondents reported learning a great deal about the WaterSense Program and, in particular, the existence and practical value of the WaterSense Outdoor Water Budget Tool (especially Version 2.0), which many had not known about at all. Participants learned how the tool uses inputs such as ZIP code, landscape size, irrigation type, efficiency assumptions, and concepts like Growing Degree Days (GDDs) to predict outdoor water use, highlight the “thirstiness” of landscapes, and identify opportunities for significant savings—especially outdoors, where reductions beyond interior measures are most impactful. Key takeaways included the role of micro-irrigation (drip irrigation), the importance of water monitoring, the relationship between water, energy, and cost savings, and how the tool can support client communication, certification strategies, and water-smart landscape design even when not mandatory. Remaining questions and points of uncertainty centered on understanding the tool’s many charts and assumptions, clarifying efficiency percentages for different irrigation systems, quantifying actual savings (including emerging practices like hand-held sprayers), and exploring additional water conservation options and related programs such as Home Water Score.


Article based on webinar* 

Abstract

Outdoor water use represents a significant portion of residential water consumption, particularly in regions experiencing rising water costs and increasing drought pressures. Thoughtful landscape design and efficient irrigation strategies can dramatically reduce water use without compromising aesthetics or functionality. EPA’s WaterSense Outdoor Water Budget Tool Version 2.0 provides a data-driven framework for evaluating and designing water-efficient landscapes by comparing a proposed design against a standardized baseline. This article explains the evolution of the WaterSense program, the structure and assumptions of the updated tool, and practical applications for builders, designers, sustainability professionals, and property owners seeking measurable reductions in outdoor water consumption.

The Growing Importance of Outdoor Water Efficiency

Water bills are rising, and drought conditions are increasingly common across the United States. In many communities, outdoor irrigation is one of the largest contributors to residential water demand, especially during peak summer months. In some cases, water scarcity has led to voluntary or mandatory restrictions on outdoor watering.

At the same time, reducing water use provides clear financial and environmental benefits. Lower water consumption reduces utility costs, supports long-term water resource resilience, and helps projects achieve certification under green building standards such as LEED for Homes and other performance-based rating systems.

Outdoor water use, however, is often less scrutinized than indoor fixtures and appliances. Toilets, faucets, and showers are commonly upgraded to WaterSense-labeled models, yet landscapes are frequently designed with default assumptions: expansive cool-season turf irrigated by spray systems. These decisions can lock in high water demand for decades.

To address this, EPA’s WaterSense program developed the Outdoor Water Budget Tool to quantify and compare landscape water use. Version 2.0 represents a significant refinement of that tool, expanding its functionality, updating assumptions, and improving usability for a broader audience.

Evolution of the WaterSense Homes Program

The WaterSense Specification for Homes was first released in 2009 as the nation’s first national certification focused exclusively on residential water efficiency. Version 1 of the specification included numerous prescriptive requirements covering both indoor and outdoor water use. One of those requirements was the use of the WaterSense Outdoor Water Budget Tool for landscape design.

In 2022, Version 2 of the specification became effective. Rather than relying heavily on prescriptive requirements, the revised framework emphasizes performance. Homes must demonstrate at least 30% greater water efficiency than a typical new home. Builders work through approved Home Certification Organizations (HCOs), which each have EPA-reviewed methods for verifying compliance with the 30% target.

Under Version 2, there are only two mandatory requirements:

  • Installation of WaterSense-labeled plumbing fixtures
  • Verification that the home is free of leaks

All other water reductions—indoor and outdoor—are evaluated through the HCO’s certification method.

Importantly, the Outdoor Water Budget Tool is no longer mandatory under the WaterSense Homes specification. However, reductions in outdoor water use remain essential to achieving the 30% efficiency target. It is extremely difficult to reach that threshold through indoor reductions alone. As a result, the tool remains a valuable design and verification resource.

Version 2.0 of the Water Budget Tool was released to reflect this shift: it is no longer a pass/fail compliance instrument but a flexible design and evaluation tool that supports multiple certification pathways and practical applications.

Core Concept: Baseline vs. Designed Landscape

At its foundation, the WaterSense Outdoor Water Budget Tool compares two scenarios:

  1. Baseline Landscape
    Assumes a landscape entirely composed of cool-season turf grass irrigated with spray irrigation. This represents a water-intensive but common default scenario.
  2. Designed Landscape
    Reflects the actual proposed or existing landscape design, including plant types, irrigation equipment, and system controls.

The tool calculates water use for both scenarios and determines the percent reduction achieved by the designed landscape relative to the baseline.

The baseline is intentionally conservative. Cool-season turf and spray irrigation represent high water demand and lower distribution uniformity. By comparing against this intensive scenario, designers can see clearly how plant selection and irrigation upgrades reduce consumption.

Key Enhancements in Version 2.0

Version 2.0 introduces several significant improvements.

Annual Water Use Calculation

Previous versions focused primarily on peak month demand. Version 2.0 expands analysis to estimate annual water use. This provides a more comprehensive understanding of total consumption over time and aligns more closely with utility billing cycles and performance certification systems.

Peak month results are still available, but annual totals are now central.

Zip Code–Specific Climate Data

The tool requires two critical inputs:

  • Zip code
  • Total landscape area

Climate data—including monthly rainfall and reference evapotranspiration (ET)—is automatically populated based on zip code. This ensures geographic specificity and reflects local environmental conditions.

Reference ET and rainfall data are drawn from national datasets processed to provide consistent coverage.

Growing Season Determination

A major refinement in Version 2.0 is the incorporation of a defined growing season by zip code.

Rather than assuming irrigation demand year-round, the tool uses temperature-based growing degree day calculations to determine when plants are actively growing and likely to require irrigation. Months outside the growing season are assigned zero irrigation need, even if ET exceeds rainfall. This adjustment significantly improves realism in colder climates.

Effective Rainfall Assumption

Not all rainfall contributes directly to plant water needs. The tool assumes that 25% of monthly rainfall is effectively available to the landscape. This conservative assumption reflects runoff and other losses.

Net ET (plant demand) is calculated as:

Monthly ET – Effective Rainfall

If rainfall exceeds ET, irrigation need is set to zero.

Irrigation Application Rate

One of the most important assumptions in Version 2.0 acknowledges real-world behavior. Research indicates that residential irrigation systems typically apply only about 58% of theoretical plant water demand.

Rather than assuming perfect irrigation matching plant demand, the baseline and design scenarios both apply a default irrigation application rate of 58%.

This assumption reflects observed behavior in the field and prevents overestimation of water use. However, the user may override this value if more accurate local data is available or if evaluating commercial systems, which may operate closer to 100% of plant demand.

Expanded Zone Capacity

Version 2.0 significantly increases the number of landscape zones that can be entered, making the tool applicable to larger residential, multifamily, or even commercial landscapes.

Credit for WaterSense-Labeled Technologies

The updated tool provides explicit water savings credit for:

  • WaterSense-labeled weather-based irrigation controllers
  • Soil moisture sensors
  • Rain sensors
  • Pressure-regulated spray sprinkler bodies
  • Systems designed or audited by irrigation professionals certified under a WaterSense-labeled program

These savings are applied system-wide and reflect documented performance improvements.

Practical Design Application: A New Construction Example

Consider a hypothetical new build in South Jordan, Utah, with approximately 3,100 square feet of irrigable landscape area.

Local code requires:

  • Drip irrigation (micro-irrigation) for non-turf areas
  • Separate irrigation zones for turf and planting beds
  • WaterSense-labeled irrigation controllers with rain delay
  • Turf limited to no more than 35% of landscaped area

Entering the site’s zip code and total landscape area into the tool automatically populates monthly ET, rainfall, and growing season data.

A baseline scenario assuming full cool-season turf and spray irrigation produces an estimated annual outdoor water use.

The proposed design includes:

  • 35% cool-season turf with spray irrigation
  • Non-turf planting beds irrigated with micro-irrigation
  • A non-irrigated patio area
  • A WaterSense-labeled weather-based irrigation controller

The tool calculates monthly and annual water use for the design scenario and compares it to the baseline.

Without system-wide efficiency features, the design may fall slightly short of a 30% reduction. However, adding the WaterSense-labeled controller and rain sensor yields sufficient additional savings to surpass the 30% reduction target.

This demonstrates how thoughtful irrigation technology selection can close performance gaps even when turf remains part of the design.

Retrofit Application: A Landscape Redesign Scenario

The tool is equally valuable for existing homes considering landscape transformations.

Imagine a homeowner in Augusta, Georgia with 10,000 square feet of irrigated landscape. The current design is primarily turf, with limited planting beds.

The homeowner wants to:

  • Add a large vegetable garden
  • Increase curb appeal with additional planting beds
  • Maintain green turf comparable to neighbors

The baseline landscape is entered. Because the homeowner irrigates aggressively, the irrigation application rate is adjusted upward from 58% to 80%.

The redesigned landscape includes:

  • Warm-season turf (zoysia)
  • Expanded planting beds
  • A vegetable garden
  • A rain sensor

The tool compares annual water use before and after redesign. Even though turf remains a large component, switching to warm-season grass and incorporating micro-irrigation for beds may reduce water demand relative to the original configuration.

This scenario illustrates how the tool can quantify trade-offs between aesthetics, recreation, and water efficiency.

Integration with Green Building Certification Systems

Although no longer required under the WaterSense Homes specification, the tool remains highly relevant to certification programs that evaluate outdoor water use under performance pathways.

Programs such as LEED for Homes and other HCO-administered rating systems require total water use calculations—including outdoor irrigation—when pursuing performance-based points.

Using the Water Budget Tool allows designers and builders to:

  • Quantify outdoor water savings
  • Support documentation for certification review
  • Explore alternative landscape strategies
  • Demonstrate compliance with local water budget requirements

In performance pathways, outdoor reductions often contribute significantly to achieving overall water reduction thresholds.

Broader Applications Beyond Certification

The WaterSense Outdoor Water Budget Tool Version 2.0 can serve multiple audiences:

  • Builders designing new subdivisions
  • Landscape architects optimizing plant selection
  • Irrigation professionals evaluating retrofits
  • Property managers assessing water use
  • Municipalities establishing water budgets
  • Utilities promoting conservation incentives

The tool can also provide rough comparisons between theoretical water use and actual metered data, offering insights into irrigation performance and potential inefficiencies.

While not designed as a billing reconciliation instrument, it can highlight discrepancies that warrant further investigation.

The Strategic Importance of Outdoor Water Management

Outdoor irrigation is highly visible. Lawns and landscapes shape community aesthetics, property values, and homeowner identity. Yet these choices have long-term resource implications.

Designing for water efficiency does not require eliminating landscape function. Rather, it involves:

  • Selecting climate-appropriate plant species
  • Separating irrigation zones
  • Using efficient distribution methods
  • Installing smart controllers
  • Accounting for realistic irrigation behavior

Version 2.0 of the Water Budget Tool translates these design decisions into measurable outcomes.

By shifting from prescriptive rules to performance-based evaluation, the updated WaterSense framework empowers professionals to innovate while maintaining accountability to water reduction targets.

As climate pressures intensify and water costs continue rising, integrating tools like this into standard design practice will become increasingly essential.

Conclusion

EPA’s WaterSense Outdoor Water Budget Tool Version 2.0 represents a mature, data-driven approach to landscape water efficiency. It moves beyond rigid compliance toward flexible performance evaluation, incorporating climate-specific data, realistic irrigation assumptions, and system-wide efficiency credits.

For sustainability professionals, builders, and landscape designers, the tool offers a transparent framework for quantifying outdoor water use and identifying meaningful reduction strategies.

Water-efficient landscapes are no longer simply a best practice; they are central to resilient, cost-effective, and certifiable green building.

Green Home Institute continues to support education and professional development around tools like this to help advance healthier and more sustainable residential environments.

Key Takeaways

  • The WaterSense Outdoor Water Budget Tool compares a water-intensive turf baseline to a proposed landscape design.
  • Version 2.0 calculates annual water use, not just peak month demand.
  • Climate data is automatically populated by zip code, including growing season determination.
  • A default irrigation application rate of 58% reflects observed residential irrigation behavior.
  • Users can override application rates for commercial or atypical scenarios.
  • The tool provides credit for WaterSense-labeled controllers, sensors, and certified irrigation professionals.
  • Outdoor water reductions are essential for achieving the 30% water efficiency target under WaterSense Homes Version 2.
  • The tool is useful for new construction, retrofits, certification documentation, and municipal water budgeting.
  • Efficient plant selection and irrigation design can significantly reduce outdoor water use without sacrificing landscape function.
*Content created by a human speaker, transcribed by Zoom, and arranged by an AI LLM
Categories
Uncategorized

Safe Electrical Upgrades for All-Electric Homes: What Designers and Builders Need to Know

Safe Electrical Upgrades for All-Electric Homes: What Designers and Builders Need to Know

https://unsplash.com/photos/four-electric-meters-mounted-on-a-red-wall-y-OKpZsZc2I


All-electric homes are central to net-zero strategies. They replace on-site fossil fuels with clean, efficient energy systems. Their success depends on electrical infrastructure that can safely support high-performance equipment like heat pumps and electric vehicle (EV) chargers.


Builders and designers must consider the long-term scalability of every panel and circuit. As electrification accelerates, code-aligned electrical design becomes a cornerstone of resilient homebuilding.

Updating Wiring and Circuit Layouts for Electrification

Standard branch wiring often falls short in all-electric homes, where continuous loads are higher and more concentrated. Segmenting circuits by appliance type and location helps avoid nuisance trips and overloads. This step also improves load balancing across the panel.


A circuit breaker’s rated current reflects the maximum it can carry indefinitely without overheating. Therefore, designers must also factor in ambient temperature and grouping when selecting breakers, as some may require derating to operate safely. For dense installations, using higher ampacity breakers and proper conduit fill ratios ensures safety and longevity in the upgraded system.

Designing for Higher Electrical Demand

https://unsplash.com/photos/a-man-pumping-gas-into-his-car-at-a-gas-station-QYyMOk2YfX8


All-electric homes introduce sustained loads from heat pumps and induction cooktops, which often operate at the same time. A wall outlet or Level 1 EV charger can run overnight to reach a full charge. These demands push electrical systems beyond what standard National Electrical Code (NEC) minimums were designed to handle.


Builders must anticipate simultaneous usage and future upgrades. Oversized service panels and thicker conductors with load-shedding capabilities offer the flexibility and headroom required for long-term safety and performance.

Retrofitting Older Homes Without Compromising Safety

Outdated electrical components, like cloth-insulated wiring and aluminum branch conductors, can pose serious risks in homes transitioning to all-electric systems. These legacy materials may not handle modern loads safely. They are also more prone to overheating, corrosion or failure.


Infrared thermal scanning and thorough breaker panel assessments help identify weaknesses before new circuits are added. Proactively replacing high-risk systems ensures the electrical infrastructure can support electrified upgrades without introducing fire or reliability hazards.

Meeting Code Requirements and Avoiding Common Hazards

https://unsplash.com/photos/interior-room-under-construction-with-exposed-pipes-and-wiring-1nFjKjHRf-Y


NEC updates continue to tighten safety requirements for EV charging stations and outdoor installations. Each of these sources carries elevated electrical demand in all-electric homes. Properly rated disconnects and clear circuit labeling are now essential for passing inspection and ensuring long-term safety.


In 2020, electrical failures contributed to 16,500 office and store fires in the U.S. These incidents resulted in more than $900 million in property damage. Builders must stay alert to common errors like overloaded breakers, illegal panel taps or homeowner-installed wiring that bypasses permitting. These dangers prove how even small oversights can lead to major consequences.

Planning for Safe Renewable and EV Integration

Grid-tied photovoltaic and battery systems introduce bidirectional power flow. In these situations, inverter compatibility and proper configuration of critical load panels are essential for safe operation. Builders must ensure that backup systems are isolated correctly and that transfer switches are installed to prevent dangerous feedback.


When wiring EV supply equipment in new or retrofit garages, best practices include conduit sizing, breaker selection and placement that allows for future expansion. Surge protection is often overlooked but is also vital, considering that 60% to 80% of electrical surges originate inside the home from cycling appliances or overloaded circuits. Weatherproofing outdoor equipment and coordinating with the utility provider further reduces the risk of system failure or safety violations.

Future-Proofing Through Smart Electrical Planning

Future-ready electrical design starts with thoughtful planning. Leaving extra space in service panels and prewiring conduit routes to high-potential areas like rooftops or garages can significantly reduce disruption when upgrades are added later. Homes anticipated to add solar or battery storage should include dual-feed options and busbars sized to handle future loads.


These steps ensure houses have adequate safeguards against accidents. Early collaboration between designers and energy consultants ensures the system performs reliably from day one and remains adaptable as energy needs evolve. Planning also improves inspection outcomes and reduces last-minute design changes. It’s a small investment that saves time and cost over the life of the home.

Why Electrical Safety Drives Long-Term Sustainability

Safe electrical upgrades make all-electric homes functional and resilient. Builders who design for higher loads, evolving codes and scalable systems set their projects up for long-term success. A safety-first approach is the foundation of modern, sustainable homebuilding.

Categories
Q&A Webinar After

Your Electric Panel, Demystified: Load Management for Home Electrification Article & Q&A

Jane Chen and Brian LaMorte joined us recently for our  Weekly Wednesday Free CEU webinar Series.

If you missed this session, want to rewatch it, or share it with a friend or colleague, you can now do so, as the recording and article on the topic are available below. 

Overall, respondents reported learning a great deal about electrical load management, especially that service upgrades are often unnecessary when smart load management devices are used. Many highlighted a new understanding of the 80% rule for panel sizing, the difference between voltage and amperage, how to calculate loads, and how panels are typically underutilized in real-world conditions. Participants were particularly struck by the idea that 100–150 amp panels are often sufficient for electrification (including EV chargers) when load prioritization and demand management are applied, and that subpanels do not increase service capacity. Several learned what load management devices are, how they integrate with main and subpanels, and that code-permitted demand management can “zero out” new loads in capacity calculations. There was also appreciation for practical alternatives to costly 200A upgrades, including products like Stepwise and other smart or add-on systems. Remaining questions centered on when full panel upgrades are truly justified, how load managers are physically wired and installed, how to assess older homes (including whether rewiring is required), how to interpret utility peak demand data versus calculated loads, and the cost, rebates, and installation considerations associated with these systems.

Q&A

Question: Does adding a subpanel increase total capacity, or just “space?” In other words, could you add 50 amps to a main panel that is 100 amps by adding a subpanel?
Answer: Adding a subpanel increases physical space for breakers, but does not change the overall “ampacity” that is available in the panel.


Question: The graphic showing all the loads is better expressed in kW than in kWh – power draw vs. energy used.
Answer: Totally fair, thanks for the input. We’ll try to update the visual in the future. I completely agree that capacity is the more important metric; most consumers are more comfortable thinking in total energy consumed since they’re used to looking at the electric bill.


Question: Beyond the install cost, are there any ongoing issues with oversizing the panel?
Answer: Oversizing the panel does not lead to issues for the homeowner, but could lead to overall electricity price increases for everyone in the long run. When home electric panels are upsized, that will also trigger transformer upgrades to occur. Any utility infrastructure costs will be rate-based in higher residential electricity prices.


Question: Is there a way to calculate how much electricity is continually drawn by smart appliances which are constantly drawing energy? For example, older appliances didn’t have things like digital clocks, but now they are standard. Over time all those little things add up. Even though tech advances, now devices require constant connection to WiFi, or our Alexa’s are always running. Is it minimal or does it add up?
Answer: The electricity you’re talking about here is very minimal in comparison to the types of capacity spikes we talk about.


Question: So can you make the panel bigger (200A) without a service upgrade, if the house has more potential than the panel accesses?
Answer: Yes, you can make the panel ampacity feel bigger by allowing the panel to use its full capacity without actually doing a service upgrade. Imagine a line graph shaped like a curve. Think of electricity usage as the area under the curve. Capacity (“ampacity”) is a measure of the amplitude of the curve. With load management, we can use more of the total area under the curve while ensuring the amplitude never gets beyond its current limits.


Question: For older houses, when the panel is upgraded for household electrification purposes, does the entire house have to be re-wired?
Answer: When the service is upgraded (i.e. from 100A to 200A), the wire from the meter to the panel often has to be sized up to accommodate the increased electron flow. The interior of the house does not need to be rewired UNLESS you’re dealing with a knob and tube system that is not code compliant. The reason that it is a lot of manual work to do the panel upgrade is because you have to replace the existing panel with a new one and reconnect all the wires, which also means tracing back the breakers to the appliances and manually taking stock that everything is connected correctly.


Question: Can you speak to peak load/startup load? I have a GSHP that I believe draws more heavily on startup and then I think it levels off… is that possible and how do you account for or possibly taper that off?
Answer: As Brian mentioned, most modern appliances no longer have a massive upfront startup peak, but if you did have a system with the peak, you could add a soft start device to manage the spike (usually ~$400).


Question: I have a 2018 200A electric panel. I would like to have a smart panel. How much would switching out the panel cost? Are there other options to gain smart capabilities with an existing panel?
Answer: A traditionally smart panel upgrade would cost ~$8K-$10K all in. Load management is a more cost effective way to manage important circuits and gain the same type of data intelligence as a smart panel for ~$1K per circuit.


Question: Cost for the Load Manager (LM)?
Answer: Hi Jane, the MSRP for the Stepwise Tap Load manager is $780. Contractor and Volume Discounts are available. Link to the store: https://getstepwise.myshopify.com/ and more overall information at www.getstepwise.com


Question: I had purchased a load management tool from SENSE and had electrician install – horrible experience that had a lot of trouble getting any data – are there tools that you recommend?
Answer: Sense is not actually considered a load management tool because it only has the ability to monitor but cannot enable control of a circuit. I can’t speak to the experience of getting access to data across the different energy monitors out there, but I would trust Reddit for its recommendations. If you are looking for control capabilities as well, then I would recommend taking a look at load management solutions.


Question: How to best convert kW to Amps? Is there a best rule of thumb?
Answer: Yes, you can think of them as being interchangeable. For instance, the measure of power is usually kWh (which is kW x time), but it is also referred to as Amp hours.


Question: I’m curious what Brian’s heating system setup is, as well as climate zone. We’re pretty far north and have some folks switching to air source heat pumps, some of which are all-electric systems.
Answer: Brian has a 2 zone heat pump for a 3500 sq ft home. He’s based in Ithaca, New York.


Question: Is there a lifetime on the devices, do they update automatically or have to be replaced every 10 years or so?
Answer: The devices can be updated over the air if they are connected to WiFi, meaning that the software program can be updated like your smart phone. You can assume the hardware part has the same lifespan as a panel, so 10 years is a good assumption.


Question: If we use historical peak demand to determine whether a panel upgrade or load management solution is needed, but a panel upgrade is being anticipated due to planned electrification, how can you be sure sizing for past peak demand will meet future peak demand?
Answer: We use historical peaks and then layer on the future loads. For instance, if peak load when looking at the previous 3 months is 30A on a 100A panel, and you’re adding an EV charger, you can assume that you would need to add in up to 48A of additional capacity during peak. If the historic load + new load is <80A, then you can add the planned project without worrying about the panel. If the new load cannot be supported by the additional panel capacity, then you could consider load management.


Question: Please DO address “smart” panels such as SPAN panels!
Answer: Smart panels are one form of load management. They are particularly suitable for new builds where it’s more cost effective to swap out a whole panel. A typical SPAN full installation costs about $8-10K in total, which is more than the cost of a dumb panel upgrade and can be difficult for many individuals to swallow as an upfront investment. The best way to select for the appropriate load manager is to think about your application and your electrification plans. If you are looking to do one off installations one at a time, then a circuit level controller offers more flexibility. If you are pursuing a whole home electrification project and have access to financing, or if you’re building a new home, a smart panel could make sense to get access to full panel controls.


Question: Are load management devices universal in terms of voltage across world zones?
Answer: Yes, in the residential context they are compatible with 240V appliances.


Question: Could the data from Stepwise help to decide how much backup storage battery capacity you need?
Answer: Yes, it could help inform battery capacity since you would know how much energy and the peak capacity the home is actually using.


Question: If the home has no EV charger, no battery, what are examples of other appliances/loads that might have the load decreased/turned off? If, for example, a home converts to a heat pump and installs load management system instead of a panel upgrade, what would the LMS “dial back” to allow the heat pump to work properly?
Answer: Any 240V appliance in the home could be controlled to be turned off. Examples include induction stoves, water heaters, snow melts, hot tubs, and heat pumps. The only caveat on heat pumps is that we would encourage you to first find other things in the home to turn off first as most people like to have control over their heating/cooling controls. Adopt the mindset of “making room for the heat pump” by putting a load manager on something else in the home.


Question: A smart panel like the SPAN solution may avoid having to increase the service upgrade.
Answer: To be clear, a SPAN panel or a smart panel install is often akin to getting a service upgrade. The only difference between a smart panel upgrade and a service upgrade is whether the utility needs to be involved to increase the service to the home. The labor involved is roughly the same and may have a higher price tag because of material costs.


Question: Are there commercial applications here as well, or strictly residential-size applications?
Answer: Yes, there are commercial applications, but because you are dealing with 480V in many commercial settings and the wiring set up is a bit more complicated, those cases would need to be dealt with on a case-by-case basis.


Question: Great, Stepwise is the name of the company?
Answer: Yes, Stepwise Electric Inc is the full name of the company. www.getstepwise.com


Question: How can you tell how much electricity your heat pumps used in a year to disclose when trying to sell your house?
Answer: You can monitor the heat pump circuit using an energy monitor or a load manager.


Question: What would you estimate the marginal cost of adding an additional 8/10 slot sub-panel to be, compared to having existing space in the main panel to add additional breakers?
Answer: On average, a subpanel could cost ~$2K and tandem breakers to make room in an existing panel would be $100-200.


Question: When doing a panel assessment in this use case described, is it prudent to validate the Earth ground copper & rod, validate the service wire conductor size related to observed load prior to sign off the inspection?
Answer: Yes, always helpful to validate the earth ground and the service wire.


Question: How are ELECTRICIANS and CODE OFFICIALS being educated on this topic?
Answer: We are conducting training sessions with inspectors and electricians both on our own and in partnership with some utilities. If you have any organizations that would benefit from education please connect us. You can email me holly@getstepwise.com


Question: Can you provide a list of good load management devices with links?
Answer:

  1. Simpleswitch – https://simpleswitch.io/
  2. DCC – https://rve.ca/en/dcc-solution/
  3. Span – https://span.io/
  4. Schneider smart panel – https://www.se.com/ca/en/work/campaign/local/qosmartpanel/
  5. Stepwise Tap – www.getstepwise.com

Question: Are arc fault parts an impact?
Answer: Cannot agree more! That’s why we believe education on the concept of load management should be widespread across all electrical and building professionals.


Question: So, if a home has 100A service, and the panel is in good condition but physically full, you could get a subpanel and a load management system. Is that generally going to cost under $2,000 or so with labor?
Answer: Yes, that is a good ballpark, although the exact price will depend on what region of the US you live in.


Article based on webinar* 

Abstract

As homes transition toward electrification to reduce carbon emissions and improve energy efficiency, the residential electric panel has emerged as a perceived bottleneck. Conventional wisdom often assumes that electrification—adding heat pumps, electric cooking, EV charging, and other high-load appliances—requires costly panel or service upgrades. However, a deeper understanding of residential electrical demand, load calculation methods, and emerging load-management technologies reveals that most homes possess substantial untapped electrical capacity. By integrating monitoring-based load management strategies, homeowners and contractors can frequently electrify existing buildings without major electrical service upgrades. This article clarifies how electric panels function, explains the limitations of traditional load calculations, and outlines when load management can safely and economically enable electrification while avoiding unnecessary infrastructure expansion.

The Electrification Challenge and the Role of the Electric Panel

Residential electrification is accelerating as buildings transition away from fossil-fuel combustion toward electric heating, water heating, cooking, and transportation. Yet the shift raises a practical concern: can existing homes support these additional electrical loads?

The electric panel—the central distribution point for household electricity—often becomes the focus of this concern. It aggregates all circuits and defines the maximum amperage available to the home. When major electric appliances are added, contractors frequently recommend upgrading from a 60- or 100-amp service to 200 amps or more. This recommendation is commonly driven by code-based load calculations that estimate potential simultaneous electrical demand.

However, these estimates rarely reflect real-world usage patterns. Most households operate well below theoretical peak loads, meaning significant capacity often exists within existing panels. Understanding this discrepancy is key to enabling cost-effective electrification.

Understanding Electric Panel Capacity and Load

An electric panel’s rating, expressed in amperes (amps), represents the maximum current the service can safely supply. The main breaker defines this limit, while branch breakers distribute power to lighting, appliances, and equipment throughout the home.

Residential systems in North America typically provide both 120-volt and 240-volt power. All homes receive 240 volts from the utility; standard outlets use one leg (120 V), while large appliances such as heat pumps or EV chargers use both legs (240 V). Panel upgrades therefore relate primarily to amperage—not voltage.

Electrical load represents the total current drawn by all active devices at a given time. Large electrification loads—heat pumps, electric ranges, dryers, and EV charging—dominate residential demand compared with lighting or plug loads.

To ensure safety, electrical codes require that calculated load remain below approximately 80 % of panel capacity. When calculated demand exceeds this threshold, traditional practice mandates a service upgrade.

The Limits of Traditional Load Calculation

Code-based load calculations are intentionally conservative. They assume worst-case simultaneous use of multiple appliances, regardless of real occupancy patterns or behavior. The result is often a substantial overestimation of true demand.

Field monitoring data consistently shows that actual peak usage is far lower than calculated values. Even fully electrified homes with EV charging often remain well below panel limits most of the time.

This gap arises because households rarely operate all major loads simultaneously. For example, laundry, cooking, space heating, and EV charging seldom coincide at full power. Consequently, calculated load may suggest the need for a 300-amp service while real peak demand remains near 100 amps.

The implication is profound: many homes possess substantial unused electrical capacity that conventional calculations fail to recognize.

What a Service Upgrade Really Entails

Upgrading electrical service is often assumed to be straightforward, but in practice it is complex, disruptive, and expensive.

A true service upgrade typically requires:

  • Replacement of the service entrance conductors
  • Installation of a new meter enclosure
  • Coordination with the utility company
  • Permitting and inspections
  • Temporary power shutdown
  • Potential trenching or conduit replacement

Underground services may require excavation to the transformer or utility connection point, which can involve driveways, landscaping, or structural barriers. In some cases, site conditions make upgrades impractical or prohibitively expensive.

Costs commonly range from several thousand dollars to well above $10,000 depending on region and installation complexity.

Even when technically feasible, service upgrades impose broader system impacts. Increasing individual home service sizes drives the need for larger neighborhood transformers and distribution infrastructure, raising system costs and ultimately electricity prices.

Oversizing and Its System-Level Consequences

Historically, electricians often oversized services to accommodate future electrification needs. While this approach avoids immediate constraints, it can produce unintended consequences.

Oversized services encourage higher instantaneous demand, even if rarely used. When many homes adopt larger services simultaneously, utilities must upgrade upstream equipment such as feeders and transformers. These infrastructure investments are shared across ratepayers, increasing long-term electricity costs.

Therefore, avoiding unnecessary upgrades is not only economical for individual homeowners but beneficial for grid efficiency and affordability.

Real-World Demand Versus Theoretical Capacity

Monitoring data offers a more accurate perspective on residential electrical demand. Whole-home monitoring or utility smart-meter data can identify the highest recorded peak load over time, revealing true capacity needs.

Measured peak demand often falls far below calculated values. Even large, fully electrified homes with EV charging frequently remain well under 200-amp service limits.

This observation demonstrates that electrification is often feasible within existing panels—especially when combined with load-management strategies that ensure safety during rare high-load intervals.

Load Management: Concept and Function

Load management provides a practical method to use existing electrical capacity more efficiently. Fundamentally, it acts as a traffic controller for household electricity.

A load-management system performs two essential functions:

  1. Monitoring real-time household electrical demand
  2. Controlling selected loads to keep total demand within safe limits

By continuously measuring current draw, the system can automatically reduce or temporarily interrupt specific appliances when the panel approaches capacity.

This approach ensures that electrical demand never exceeds panel ratings while enabling additional electrification loads to be installed.

How Load Management Works in Practice

Load-management devices may be installed at several points in the electrical system—within the main panel, a subpanel, or directly on a circuit serving a specific appliance. Sensors monitor incoming service conductors to determine total household load.

When demand approaches a preset threshold, the system acts automatically. For example, an EV charger may temporarily reduce charging rate or pause operation during peak household use. Once demand falls, full operation resumes.

The process is largely invisible to occupants because peak coincidences are brief and infrequent. For most homes, load management operates only occasionally as a safeguard rather than a routine control.

Types of Load-Management Solutions

Load management can take several forms depending on project scope:

  • Circuit-level controllers for individual appliances
  • Smart breakers or panels controlling multiple loads
  • Whole-home energy-management systems
  • Integration with solar or battery systems

Smart electrical panels represent one comprehensive implementation, monitoring and controlling each branch circuit. Circuit-level devices provide a simpler alternative when adding a single load such as EV charging.

The appropriate solution depends on whether electrification involves a single appliance or whole-home transformation.

Integration with Renewable Energy and Storage

Load management also plays a role in homes with solar generation or battery storage. During grid outages or limited battery capacity, the system can prioritize essential loads and defer discretionary ones.

For example, heating may take precedence over EV charging during backup operation. This dynamic prioritization offers flexibility beyond fixed “critical load panels,” enabling more adaptive energy use during outages or peak conditions.

Safety and Code Compliance

Modern load-management systems are recognized within electrical codes as energy-management systems. When properly listed and installed, they are fully compliant and acceptable to inspectors.

By actively preventing panel overload, load management enhances electrical safety. It ensures that total demand never exceeds design limits, reducing risk of overheating or fire while enabling electrification without service expansion.

Economic Advantages

Avoiding service upgrades produces significant cost savings. Load-management installation typically costs a fraction of a full upgrade, often near one-quarter or less of the expense.

Beyond direct cost reduction, load management shortens project timelines. Service upgrades require permitting, utility coordination, and inspections, whereas load-management installation may be completed rapidly without utility involvement.

These advantages make electrification accessible to more homeowners, especially where upgrade costs are prohibitive.

When Load Management Is Appropriate

Load management is most effective when additional electrical demand occurs only occasionally or for short durations. Typical examples include EV charging, electric cooking, or intermittent appliance use.

In such cases, existing panels often possess sufficient capacity for most operating conditions, with load management handling rare coincidences.

Many homes can achieve full electrification on services as small as 150 amps when real usage patterns and load management are considered.

When a Service Upgrade Is Still Necessary

Load management does not replace all upgrades. Certain conditions require increasing service capacity:

  • Severely undersized or unsafe existing service
  • Obsolete or damaged panels
  • Extensive simultaneous high-load equipment (e.g., pools, workshops, multiple heat pumps)
  • Commercial-scale or continuous heavy loads

If multiple large loads operate frequently and concurrently, relying on load management alone would cause frequent interruptions or reduced performance. In such cases, increasing service size remains appropriate.

Policy and Incentive Considerations

Public policy increasingly recognizes the value of load management in enabling electrification without infrastructure expansion. Some jurisdictions provide incentives for electrifying homes without panel upgrades, reflecting the grid benefits of efficient capacity use.

Federal and state rebate programs may also support load-management installations alongside electrification measures, further improving project economics.

Toward Smarter Electrification

Electrification need not be constrained by existing electrical panels. By shifting from conservative theoretical calculations to data-driven demand management, the industry can unlock unused capacity in millions of homes.

This approach aligns economic, environmental, and grid objectives:

  • Lower homeowner costs
  • Faster electrification adoption
  • Reduced infrastructure expansion
  • Improved grid efficiency

Load management therefore represents a critical enabling technology for large-scale residential decarbonization.

Conclusion

The perception that electrification requires widespread electrical service upgrades is often overstated. Traditional load calculations significantly overestimate real residential demand, leading to unnecessary infrastructure expansion and cost.

Monitoring-based load management provides a safe, code-compliant method to utilize existing electrical capacity more effectively. By dynamically controlling loads during rare peak conditions, it enables most homes to adopt electric heating, cooking, water heating, and transportation without major panel upgrades.

For sustainability professionals, builders, and contractors, understanding this distinction is essential. Smart electrification depends not only on efficient appliances but also on intelligent use of existing electrical infrastructure.

Key Takeaways

  • Most homes use far less electrical capacity than traditional load calculations assume.
  • Electrical service upgrades are costly, disruptive, and often unnecessary for electrification.
  • Load-management systems monitor demand and automatically control appliances to prevent overload.
  • Many homes can fully electrify on existing services—often as low as 150 amps—with load management.
  • Upgrades remain necessary only when loads are frequent, continuous, or structurally unsafe.
  • Avoiding unnecessary service expansion benefits homeowners and the broader electric grid.
*Content created by a human speaker, transcribed by Zoom, and arranged by an AI LLM
Categories
Guest Articles

Designing Zero-Carbon Homes: Combining Energy-Efficient Envelopes with Residential Solar Solutions

Designing Zero-Carbon Homes: Combining Energy-Efficient Envelopes with Residential Solar Solutions


As the sustainability movement rises in the world of consumerism, luxury home trends are departing from grandiose square footage and dramatic features in favor of intelligent environmental consciousness. Home buyers in 2026 value the power of investing in energy independence and resilience against climate volatility. A strong connection between the building envelope and solar technology ensures the elimination of operational carbon footprint, transforming homes into self-sustaining assets.

High-Performance Building Envelopes

Regulatory mandates in North America increasingly favor zero-carbon-ready construction. However, a true zero-carbon home requires a holistic strategy that balances passive and active systems. The building envelope should be the first consideration when constructing an environmentally sustainable home. By using advanced insulation and airtight seals, designers can significantly reduce a home’s energy demand. 


Having a “fabric-first” approach ensures that active systems, such as cooling and heating, require a significantly lower load to operate. This means choosing the right materials, especially in North America’s highly varying climates. Colder areas can adopt thermal-bridge-free construction to trap heat and prevent cold air from entering the building. Sunnier areas can use self-shading facades to minimize solar heat gain.


Innovative materials are central to creating an energy-efficient living space. Modern designers are now using enclosure assemblies that act as carbon sinks, such as bio-based insulation or carbon-sequestering concrete. These materials allow the building to offset its embodied carbon over time. 

Solar Integration and BIPV Technology

Solar integration now entails more than simply placing panels on a home’s roof. Thanks to Building-Integrated Photovoltaics (BIPV), the energy-efficient technology can be integrated into a building’s structure, making it a core part of the architectural design process rather than an add-on. BIPV entails the shingles and cladding of a building being capable of absorbing and repurposing the sun’s energy. This makes a residence considerably more energy-efficient, with walls covering a greater area of a building than roofs ever could. 


Building Information Modeling (BIM) helps optimize BIPV integration and performance, allowing architects to perform solar studies and extract the right information about a building. The data-centered approach that BIM brings ensures maximum power and architectural integrity, striking the perfect balance between functionality and aesthetics. 

Residential Energy Storage

An energy-efficient home is only as effective as its energy storage systems. Because solar production often peaks when household demand is low, finding the right residential battery system is nonnegotiable. For residents looking to build a green home, unveiling the right storage solution requires navigating many technical considerations to ensure safety and long-term functionality. 


There are many factors to look into when choosing the ideal uninterruptible power supply battery for a zero-carbon home. When creating a sustainable living space, the battery chemistry of a storage system is an important decision. Lithium-ion batteries are commonly used in electronic devices due to their lower cooling needs and extended service life. In North America, these systems typically allow for whole-home backup, meaning homes can function independently of the municipal grid for extended periods. 

Smart Energy Management and Automation

With automated systems advancing rapidly in the modern world, it’s no surprise that AI-integrated smart energy management systems (SEMS) have become increasingly popular in green homes. 


Essentially, SEMS act as the brain of the house, using AI to analyze household energy-use patterns and even weather forecasts and planning reliance on different systems accordingly. By learning when a family typically uses high-energy appliances, these hubs can shift load times to coincide with solar production, reducing reliance on stored power and ensuring the building envelope and solar array operate optimally. 


Automation also helps minimize the “vampire” energy loads that slowly eat at efficiency. Looking into smart home upgrades — such as automated window shades that respond to solar heat or smart thermostats that sync with the building’s temperature — can meaningfully reduce the energy footprint.

The Long-Term Returns for Zero-Carbon Construction

It is no secret that designing a zero-carbon home is a significant up-front investment compared to traditional methods. While envelopes and BIPV can be costly purchases, the long-term ROI is becoming evident. In North America, homeowners looking to integrate sustainability into their residences are advised to explore federal and state incentives, including tax credits for solar installations, that help offset costs. 

Furthermore, these homes are growing in demand for their low operational costs and environmental footprint, making their resale potential high. As climate awareness and energy costs continue to rise, many homeowners may continue seeking and investing in homes that promise long-term benefits. 

Building Toward a Sustainable Future

As sustainability movements and technology supporting them continue to grow in North America, the gap between traditional and net-zero construction will continue to close. For green building professionals, mastering integration today ensures their skills remain relevant and their projects remain highly valued in the decades to come. The best architects understand that homes can be both beautiful and environmentally conscious.

Categories
Q&A Webinar After

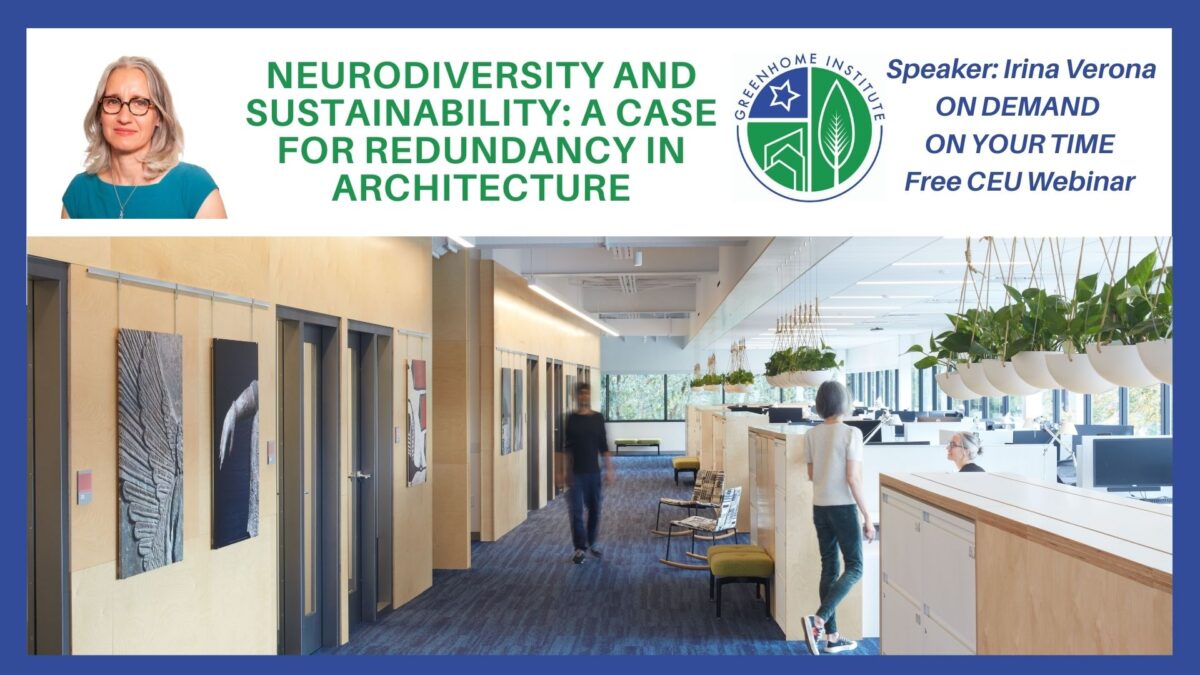
Neurodiversity and Sustainability: A Case for Redundancy in Architecture Article & Q&A – Copy

Irina Verona and guest GHI board secretary Meghan joined us recently for our  Weekly Wednesday Free CEU webinar Series.

If you missed this session, want to rewatch it, or share it with a friend or colleague, you can now do so, as the recording and article on the topic are available below. 

Overall, respondents indicated that the webinar significantly expanded their understanding of neurodiversity and its relevance to architecture and sustainability, with many noting that they had previously given little thought to neurodivergent users or to concepts like neuroinclusive spaces, sensory audits, or functional and sensory redundancy. Participants reported learning that an estimated 15–20% (or more) of the population is neurodivergent, and that design elements such as lighting, acoustics, furniture, circulation, exposed structure, wayfinding, and even appliance noise play a critical role in comfort, cognitive function, and inclusion. The idea of redundancy—providing multiple ways to achieve comfort or perform the same function—stood out as a key takeaway, reframing sustainability around human experience, choice, flexibility, and abundance rather than minimalism or code compliance alone. Attendees also valued the integration of accessibility, sustainability, and lived experience, noting that inclusive design goes beyond ADA requirements and often requires deeper conversations with building owners, especially in historic contexts. Remaining questions and areas of curiosity centered on practical implementation: how to resolve ADA constraints beautifully in existing buildings, what standards or guidelines currently exist for neurodiversity, how to apply these ideas consistently in real projects, and how far the profession can push beyond code toward truly inclusive, occupant-centered design.

Follow up after the webinar

“One idea I didn’t fully unpack in my talk last week — and that feels worth sitting with — is the variability of our spatial experience.

There is no universal way to experience space.

We all experience space differently because we process information through our senses differently. And all of our senses participate in this process: touch, sight, hearing, smell, taste, proprioception (body sense), vestibular sense (balance), and interoception (our internal physiological needs). The same environment can feel very different to each person.

Yet in architecture — and especially in energy code standards — we often design as if comfort is stable, measurable, and broadly shared. Take thermal comfort as an example. The ASHRAE 55 comfort chart defines a relatively narrow range of temperature and humidity that is considered acceptable, calibrated to satisfy about 80% of occupants in a room.

Variability is often treated as statistical noise rather than as a design condition. But in practice, this variability is essential and will determine whether a person is enabled or disabled by their environment, and whether they can do what they need to do at home or at work.

It’s also worth remembering that codes are not fixed. They change in response to new knowledge, technologies, and social values. Minimum ventilation standards, for example, have shifted dramatically over time — tightening, loosening, and even spiking during periods when indoor smoking was common. What we consider “healthy” or “acceptable” air has never been static.

If codes can evolve in response to energy use, public health, and environmental performance, they can also evolve to reflect a broader understanding of human experience, and, by extension, of comfort.

Designing for variability means moving away from singular solutions and toward environments with options: different sensory characteristics; multiple ways to participate, engage, or control; and the ability to adapt over time. Comfort, in this framing, is not a single target but a range.

And it is dependent on redundancy in building systems and spaces. If sustainability is about long-term performance and resilience, then human experience can’t be standardized or assumed. Environments that support the broadest range of bodies and minds are more functional, durable, more equitable, and ultimately more sustainable.”

Article based on webinar* 

Abstract

Sustainability in the built environment has traditionally focused on reducing energy use, minimizing material consumption, and lowering emissions. While these goals remain essential, they are incomplete without a parallel consideration of human diversity—specifically neurodiversity. Neurodiversity recognizes the natural variation in how people perceive, process, and interact with their environments. When sustainability is understood only through efficiency and reduction, buildings risk becoming optimized for a narrow range of occupants, unintentionally excluding many others. This article explores how integrating neurodiversity into sustainable design reframes sustainability itself, shifting it from a model of austerity toward one of resilience, abundance, and redundancy. Through an examination of sensory experience, comfort standards, building systems, and design processes, it argues that environments designed for a broader range of bodies and minds are not only more inclusive, but also more durable, adaptable, and ultimately more sustainable.

Rethinking Sustainability Through Human Experience

Sustainability has long been framed as a response to environmental limits. From early environmental legislation to contemporary climate policy, the dominant narrative has emphasized conservation, efficiency, and reduction. In the building sector, this approach has translated into tighter envelopes, lower energy loads, and increasingly sophisticated performance standards. These measures are critical, particularly given that buildings account for a significant portion of global emissions. However, sustainability has never been purely environmental. From its earliest formal definitions, it has also been social—concerned with equity, health, and the well-being of present and future generations.

Yet, in practice, the social dimensions of sustainability often remain secondary. Health is frequently reduced to air quality, daylight, or thermal performance, while accessibility is commonly understood as a question of physical mobility alone. This narrow framing overlooks a fundamental truth: people experience buildings in profoundly different ways. A space that feels comfortable, legible, and supportive to one person may feel overwhelming, distracting, or even disabling to another. Sustainability, when divorced from this reality, risks serving only a subset of its intended beneficiaries.

Neurodiversity offers a powerful lens through which to expand sustainability’s scope. It challenges the assumption of a “typical” user and calls for environments that acknowledge and accommodate a wide spectrum of sensory and cognitive experiences. When sustainability is viewed through this lens, the question shifts from how little a building can consume to how well it can support diverse human needs over time.

Understanding Neurodiversity in the Built Environment

Neurodiversity refers to the natural variation in human neurocognitive functioning. It encompasses both neurotypical individuals and those who are neurodivergent, including people who are autistic, have ADHD, dyslexia, dyspraxia, anxiety, depression, or post-traumatic stress. Estimates suggest that roughly 15–20 percent of the population is neurodivergent, though the true number may be higher due to underdiagnosis and social stigma.

Importantly, neurodiversity is not synonymous with disability, though the two can overlap. Many neurodivergent individuals are disabled not by their neurological differences, but by environments that fail to accommodate them. When spaces are designed around a narrow set of sensory assumptions—about noise, light, movement, or spatial complexity—they can actively prevent participation. In this sense, disability is often produced by design rather than inherent to the individual.

Central to neurodiversity is the recognition that there is no universal response to space. People process sensory information differently across all senses, including sight, sound, touch, smell, balance, body awareness, and internal physiological cues. Some individuals are hypersensitive to stimuli, while others seek sensory input. As a result, identical environments can elicit vastly different experiences. A classroom described as “energetic and collaborative” by some occupants may be experienced as “distracting” or overwhelming by others. Space, therefore, is never neutral.

Neuro-Inclusive Space and the Role of Affordances

A neuro-inclusive space is one designed with an understanding that sensory experience is individual rather than universal. Instead of assuming a single optimal condition, such spaces provide multiple affordances—different ways of occupying, navigating, and experiencing an environment. Affordances may include variations in lighting levels, acoustic conditions, spatial enclosure, or furniture types, allowing occupants to choose what best supports their needs at a given moment.

This emphasis on choice and agency represents a departure from traditional approaches to accessibility, which often focus on minimum compliance with dimensional standards. While physical accessibility codes such as the Americans with Disabilities Act have transformed the built environment for people with mobility impairments, comparable requirements for sensory and cognitive accessibility remain largely absent. Existing guidelines addressing neurodiversity are typically voluntary and unevenly applied.

Designing beyond code, however, does not mean abandoning rigor. On the contrary, it requires deeper engagement with occupants and more nuanced thinking about how spaces function over time. Neuro-inclusive design acknowledges that needs change throughout the day, across seasons, and over the lifespan of a building. By anticipating variability rather than resisting it, such spaces become more adaptable and resilient.

Sustainability Codes and the Myth of Universal Comfort

Most sustainability standards implicitly assume that improving building performance will automatically improve occupant comfort and well-being. Comfort, however, is often defined narrowly. Thermal comfort standards, for example, identify a relatively small range of temperature and humidity conditions deemed acceptable for a majority of occupants. These standards typically aim to satisfy approximately 80 percent of users, leaving the remaining 20 percent outside the comfort zone by definition.

This statistical approach reveals an underlying assumption: that discomfort for a minority is an acceptable trade-off for efficiency. In practice, this assumption is frequently challenged, as anyone who has witnessed disputes over thermostats can attest. Comfort is not a single point or even a narrow band; it is a spectrum.

Similar limitations appear in standards addressing lighting, acoustics, and indoor air quality. While certification systems such as the WELL Building Standard and the Living Building Challenge place greater emphasis on human health, they often still rely on standardized notions of comfort and performance. Variability, choice, and sensory diversity remain difficult to reconcile within frameworks designed around optimization.

Redundancy as a Sustainable Design Strategy

At first glance, redundancy may appear incompatible with sustainability. The term is often associated with excess, inefficiency, or waste. However, in fields such as ecology, engineering, and systems design, redundancy is recognized as a cornerstone of resilience. Functional redundancy allows systems to adapt, absorb shocks, and continue operating when conditions change.

In ecological systems, multiple species often perform similar roles, ensuring stability even when individual components fail. Similarly, in buildings, redundancy can support adaptability and long-term use. When applied thoughtfully, redundancy does not mean duplicating systems indiscriminately. Instead, it involves providing multiple pathways, options, and layers of functionality that allow occupants to interact with spaces in different ways.

In the context of neurodiversity, redundancy becomes a means of inclusion. Multiple circulation routes, varied lighting conditions, alternative seating options, and overlapping program spaces enable users to select environments that align with their sensory and cognitive needs. Far from being wasteful, these strategies can extend a building’s useful life by accommodating a wider range of activities and users without major alterations.

Designing for Redundancy Across Scales

Redundancy can be integrated at every scale of design, from early planning to detailed systems coordination. At the level of process, inclusive engagement with occupants—using multiple modes of communication and participation—ensures that diverse perspectives inform decision-making from the outset. Sensory audits and post-occupancy evaluations help identify barriers that may not be visible through drawings alone.

At the spatial scale, loosening the relationship between program and form allows rooms and circulation areas to support multiple uses. Corridors can become places for pause, movement, or retreat rather than mere conduits. Lounges adjacent to circulation can vary in acoustic character, lighting, and furniture, offering choice without significantly increasing square footage.

Building systems also play a critical role. Zoning mechanical systems to allow localized control can support both comfort and energy efficiency. Lighting systems that combine natural light, layered artificial lighting, and user controls create environments that respond to changing needs throughout the day. Acoustics, though often underregulated, are equally vital; integrating absorptive materials, spatial buffering, and flexible furnishings can dramatically alter sensory experience.

Furniture and finishes provide another layer of redundancy. Offering a range of seating types—rigid, soft, enclosed, mobile—acknowledges different preferences for posture, movement, and social interaction. Signage and wayfinding elements that rely on visual landmarks, color, or art can enhance legibility and reduce cognitive load, particularly in complex buildings.

Inclusion, Adaptability, and Long-Term Sustainability

Buildings that support neurodiversity tend to be more adaptable over time. By accommodating variability rather than enforcing uniformity, they are better equipped to respond to changing demographics, programs, and cultural expectations. This adaptability reduces the need for frequent renovations or premature obsolescence, aligning social inclusion with environmental responsibility.

Moreover, neuro-inclusive environments challenge the notion that sustainability requires deprivation. Instead of framing sustainability as a series of constraints, they present it as an opportunity to design richer, more responsive spaces. Redundancy, when understood as abundance rather than excess, becomes a tool for balancing efficiency with humanity.

Conclusion

Sustainability cannot be fully realized without inclusion. A building that conserves energy but excludes a significant portion of its occupants falls short of its social responsibility. By integrating neurodiversity into sustainable design, architects, builders, and sustainability professionals can expand the definition of what it means to build green. Functional and sensory redundancy offer a framework for creating environments that are resilient, adaptable, and welcoming to a broad range of bodies and minds. In doing so, sustainability moves beyond reduction toward a more holistic vision—one that recognizes diversity not as a challenge to be managed, but as a resource to be embraced.

Key Takeaways

  • Sustainability is both environmental and social; addressing one without the other produces incomplete outcomes.
  • Neurodiversity highlights the wide range of sensory and cognitive experiences that buildings must support.
  • There is no universal definition of comfort; standardized thresholds inherently exclude some occupants.
  • Neuro-inclusive design prioritizes choice, agency, and multiple affordances within the same environment.
  • Redundancy, when applied thoughtfully, enhances resilience and adaptability rather than undermining efficiency.
  • Designing for variability across space, systems, and time supports long-term sustainability and inclusion.
  • Buildings that work for the broadest range of users are more durable, flexible, and socially responsible.
*Content created by a human speaker, transcribed by Zoom, and arranged by an LLM.
Categories
Q&A Webinar After

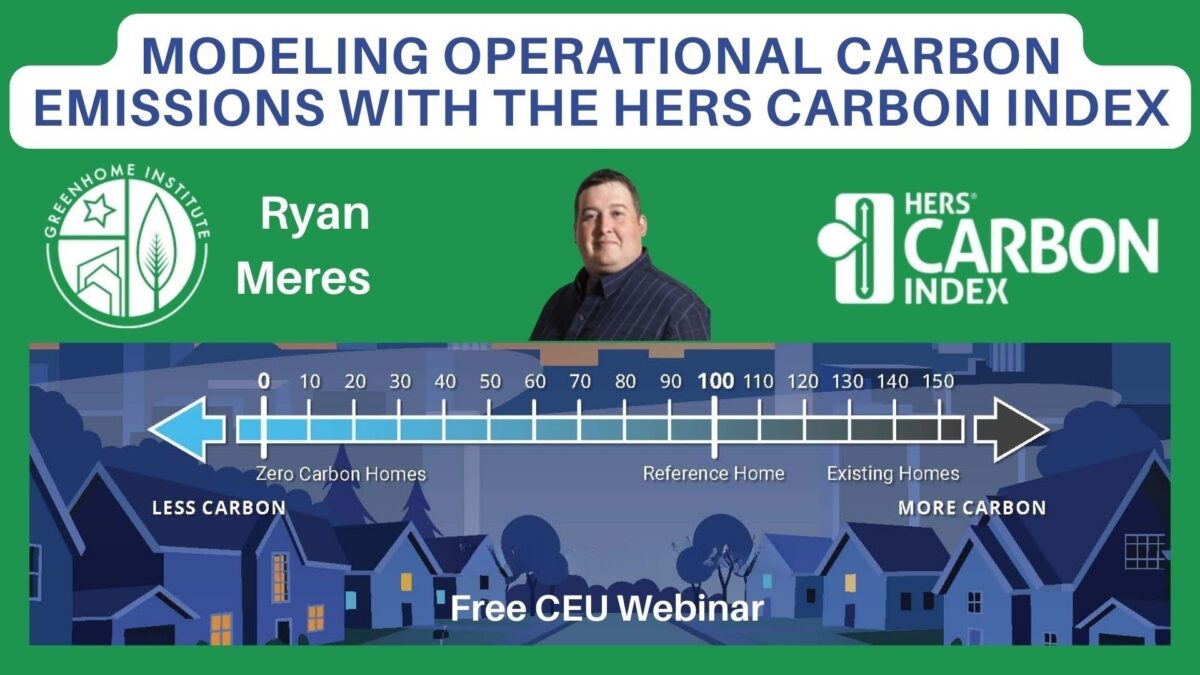
Modeling Operational Carbon Emissions with the HERS Carbon Index Article & Q&A

Ryan Meres joined us recently for our  Weekly Wednesday Free CEU webinar Series.

If you missed this session, want to rewatch it, or share it with a friend or colleague, you can now do so, as the recording and article on the topic are available below. 

Overall, respondents reported learning a great deal about the HERS Carbon Index, how it differs from the traditional HERS energy index, and why both must be reviewed together to understand a home’s true environmental impact. They gained clearer insight into operational versus embodied carbon, carbon intensity, the influence of grid mix, climate, and time-of-day energy use, and why a net-zero energy home is not necessarily net-zero carbon. Many were surprised by the limitations of current HERS modeling for electrification, the role of onsite renewables (not RECs), and the fact that a low or even zero HERS score can still produce a non-zero carbon index. Participants also learned about RESNET standards, state-level trends, tools like NREL Cambium data, and emerging embodied-carbon reporting efforts. At the same time, lingering questions remain about how electrification retrofits affect HERS scores, how embodied carbon will ultimately be benchmarked, how off-site impacts like gas leakage and power-plant emissions should be accounted for, and how to reduce confusion and improve clarity in carbon reporting and interpretation

Q&A

Q.Solar covers 100%, but net metering runs off a nuke plant 5 miles away, would that be zero carbon?

A. In theory yes, it would be, but the NREL Cambium Data does not go down to the level of an individual power plant that serves the home, so even though the power plant closest to your house in nuclear, the Cambium data will take into account other electric generation sources on the grid in your region.

Q. What is the best way to use this information in our implementations and what will this data do for us 5 years from now? What does this data look like then? Will this always be a pursuit, not a goal?

A. As NREL updates the Cambium database, presumably the grid will get more clean energy sources and the emissions factors will go down. Those new emissions numbers will impact the carbon index and we can compare emissions of homes today with those built 5 years from now.

Article based on webinar* 

Abstract

Operational carbon emissions from residential buildings are increasingly recognized as a critical component of climate impact, alongside energy use and cost. As homes become more efficient and electrification accelerates, the ability to measure, compare, and reduce operational carbon emissions at the project and portfolio level is becoming essential for builders, designers, policymakers, and sustainability professionals. The HERS Carbon Index provides a standardized, transparent framework for quantifying operational carbon emissions using established residential energy modeling practices. By building on the widely adopted HERS Index and incorporating time-sensitive, forward-looking emissions data, the HERS Carbon Index enables more informed design decisions and supports emerging requirements in green building programs, codes, and sustainability reporting. This article explores how the HERS Carbon Index works, why time-of-use and fuel choice matter, and how operational carbon modeling is shaping the future of residential construction and renovation.

From Energy Efficiency to Carbon Accountability

For decades, residential energy modeling has focused on reducing energy consumption and associated costs. Tools such as the HERS Index have become foundational in residential green building, providing a consistent, performance-based metric that supports ENERGY STAR certification, LEED compliance, and numerous state and local programs. Lower HERS scores indicate greater energy efficiency, allowing project teams to compare homes against a standardized reference and pursue increasingly ambitious performance targets.

As the building sector has evolved, however, it has become clear that energy use alone does not fully capture environmental impact. Two homes with similar energy performance can have markedly different greenhouse gas emissions depending on fuel sources, grid characteristics, and when energy is consumed. This recognition has shifted attention toward operational carbon emissions—the carbon dioxide released as a result of operating a home over time.

The HERS Carbon Index responds to this shift by extending familiar energy modeling practices into the realm of carbon accounting. Rather than replacing the HERS Index, it complements it, translating modeled energy use into a carbon-based performance metric that can be compared across regions, fuel types, and design strategies. In doing so, it enables practitioners to address energy, cost, and carbon together rather than in isolation.

Operational Carbon in the Context of Residential Buildings

Operational carbon represents emissions associated with day-to-day energy use, including space heating, cooling, water heating, appliances, and lighting. While embodied carbon—the emissions tied to material extraction, manufacturing, and construction—constitutes a significant upfront impact, operational emissions accumulate year after year. Over the lifespan of a home, operational carbon can exceed initial embodied emissions, particularly when inefficient systems or high-carbon fuels are used.

Reducing operational carbon therefore hinges on several interrelated strategies. Lowering overall energy demand through efficiency measures remains foundational. Improving envelopes, optimizing mechanical systems, and selecting efficient appliances directly reduce energy consumption and, by extension, emissions. Beyond efficiency, the carbon intensity of energy sources becomes decisive. Electrification, renewable energy integration, and thoughtful consideration of when energy is used all influence a home’s operational carbon profile.

The HERS Carbon Index captures these dynamics within a standardized modeling framework, allowing design and fuel choices to be evaluated through a carbon lens without requiring entirely new data collection or inspection processes.

The Evolution of Carbon Modeling within the HERS Framework

Carbon calculations have been part of residential energy modeling standards for more than a decade. Early versions of ANSI/RESNET/ICC Standard 301 included methods for estimating operational emissions based on historical electricity generation data and fuel-specific emissions factors. These calculations produced estimates of total carbon emissions but did not translate them into an index score comparable to the HERS Index.

The introduction of the HERS Carbon Index marked a significant evolution. Adopted as an addendum to Standard 301 and carried forward into subsequent versions, the carbon index reframed emissions data into a normalized score. This made carbon performance easier to interpret, compare, and communicate, much like the familiar HERS energy score.

Crucially, the updated methodology also modernized how emissions are calculated. Rather than relying solely on backward-looking averages, the HERS Carbon Index incorporates forward-looking, time-dependent emissions data, reflecting anticipated changes in grid composition and renewable energy adoption. This shift aligns operational carbon modeling with real-world trends and long-term planning horizons.

Time of Use and Why Hourly Modeling Matters

One of the most consequential aspects of the HERS Carbon Index is its reliance on hourly energy simulations. Residential energy use is not evenly distributed over time, nor are grid emissions. Electricity can be relatively clean during periods of high renewable generation and more carbon-intensive at other times.

By using RESNET-accredited software capable of hourly modeling, the HERS Carbon Index accounts for these variations. Energy consumption is paired with time-specific emissions factors, allowing the model to reflect when energy is used, not just how much is used. This approach reveals patterns that annual averages obscure.

For example, on-site solar generation often peaks during midday, coinciding with lower grid emissions in regions with significant renewable penetration. However, peak household demand may occur in the evening, when solar output declines and emissions rise. A home can therefore achieve net-zero annual energy use while still producing non-zero operational carbon emissions if energy consumption and clean generation are temporally mismatched. The HERS Carbon Index captures this reality, highlighting the importance of load timing and grid interaction.

Fuel Choice and Its Carbon Implications

Fuel selection remains one of the most influential factors in operational carbon outcomes. The HERS Carbon Index uses an all-electric reference home as its baseline, reflecting broader decarbonization goals and the increasing availability of low-carbon electricity. Against this reference, the use of combustion fuels such as natural gas, propane, or fuel oil generally results in higher carbon index scores.

Modeling data consistently show that homes using gas for space heating and water heating exhibit significantly higher annual carbon emissions than comparable all-electric homes, even when electricity grids are not fully decarbonized. In regions with relatively clean electricity, the carbon penalty associated with combustion fuels becomes especially pronounced.

It is important to note that the HERS Carbon Index is an asset rating. It evaluates the systems and conditions within the home at the time of rating. Emissions associated with upstream fuel extraction, distribution losses, or fugitive methane leaks outside the home are not directly modeled beyond standardized pre-combustion factors. While these external factors are relevant to broader climate discussions, the asset-based approach ensures consistency and verifiability within the rating system.

Regional Grid Characteristics and Carbon Outcomes

Electricity is not equally carbon-intensive everywhere, and the HERS Carbon Index reflects this regional variation. By drawing on granular grid data, the model differentiates between regions with cleaner electricity supplies and those still dominated by higher-emission generation sources.

Homes located in heating-dominated climates often face higher operational carbon emissions due to greater energy demand and a higher prevalence of combustion heating. Conversely, regions with substantial renewable generation can achieve lower emissions for equivalent electric loads. The index enables practitioners to see how climate, grid mix, and design choices interact, reinforcing the importance of regionally appropriate strategies.

Forward-looking emissions projections further enhance this perspective. By incorporating anticipated grid changes through mid-century, the HERS Carbon Index acknowledges that today’s design decisions will play out on an evolving energy system. Homes designed for electrification and efficiency are better positioned to benefit from ongoing grid decarbonization over time.

Net-Zero Energy Does Not Necessarily Mean Zero Carbon

One of the more revealing insights enabled by the HERS Carbon Index is the distinction between net-zero energy and net-zero carbon. A home can offset its annual energy use through on-site generation and achieve a HERS Index score of zero while still producing measurable operational carbon emissions.

This outcome arises from the timing mismatch between energy production and consumption, as well as the carbon intensity of grid electricity during different periods. The carbon index makes this distinction explicit, underscoring that energy balance alone is not a sufficient proxy for emissions reduction.

Recognizing this difference encourages more nuanced approaches to decarbonization. It shifts attention toward load management, electrification strategies, and future technologies that can better align consumption with low-carbon generation.

Integration into Practice: Ratings, Labels, and Transparency

From a practical standpoint, the HERS Carbon Index is designed to integrate seamlessly into existing HERS rating workflows. The same data collected for a HERS energy rating are used to generate the carbon index score, with calculations performed automatically within accredited software. No additional inspections or data inputs are required for operational carbon modeling.

Carbon index results are included on the HERS rating certificate and summarized on the RESNET Rated Home Label. This transparency supports consumer awareness, professional reporting, and portfolio-level analysis. By presenting energy and carbon performance side by side, the label helps stakeholders understand trade-offs and opportunities at a glance.

Emerging Applications and Policy Relevance

As carbon metrics gain prominence, the HERS Carbon Index is increasingly viewed as a tool for broader applications. Builders are incorporating carbon data into sustainability and ESG reporting, responding to investor interest in emissions performance. Utilities and municipalities are exploring incentive structures that prioritize carbon reduction rather than energy savings alone.

In the regulatory arena, proposals have emerged to include carbon index reporting within energy codes or to allow carbon-based compliance pathways alongside traditional energy targets. While these efforts are still evolving, they reflect a growing recognition that carbon outcomes must be explicitly addressed to meet long-term climate goals.

Operational Carbon and the Path Toward Carbon Intensity Metrics

While the HERS Carbon Index focuses on operational emissions, it does not exist in isolation from embodied carbon considerations. Standardized methods for quantifying embodied carbon are under development, with the aim of producing verifiable, comparable results for materials and construction practices.

Looking ahead, the concept of carbon intensity—combining operational and embodied emissions over time—offers a more holistic framework for evaluating building performance. Such an approach acknowledges that upfront material choices and long-term energy performance are interconnected. Higher embodied carbon materials may be justified if they enable substantial operational emissions reductions over the building’s lifespan.

The evolution toward integrated carbon metrics promises greater flexibility for builders and designers, allowing multiple pathways to achieve meaningful emissions reductions while balancing cost, constructability, and performance.

Conclusion

The HERS Carbon Index represents a critical step forward in residential sustainability, translating established energy modeling practices into actionable carbon insights. By accounting for time-dependent emissions, regional grid characteristics, and fuel choices, it provides a more accurate picture of a home’s operational climate impact.

For sustainability professionals, builders, and policymakers, the index offers a practical, standardized tool to inform design decisions, support emerging requirements, and communicate carbon performance with clarity. As the building sector continues to align energy efficiency with climate objectives, operational carbon modeling will play an increasingly central role in shaping resilient, low-emission homes.

Key Takeaways

  • The HERS Carbon Index quantifies operational carbon emissions using the same data collected for HERS energy ratings.
  • Time-of-use modeling reveals emissions patterns that annual energy totals alone cannot capture.
  • Electrification and fuel choice have a major influence on operational carbon outcomes.
  • Net-zero energy performance does not automatically equate to net-zero operational carbon.
  • Regional grid characteristics significantly affect carbon emissions from electric loads.
  • Carbon index scores are automatically generated and included on HERS rating certificates and labels.
  • The index supports emerging needs in sustainability reporting, incentives, and energy code development.
  • Future integration with embodied carbon metrics may enable more comprehensive carbon intensity assessments.
*Content created by a human speaker, transcribed by Zoom, and arranged by ChatGPT
Categories
Q&A Webinar After

Tour an All-Electric, Solar Shingle, Amish-Built Forever Home Article & Q&A

Joe Deden joined us for our  Weekly Wednesday Free CEU webinar Series.

If you missed this session, want to rewatch it, or share it with a friend or colleague, you can now do so, as the recording and article on the topic are available below. 

Overall, respondents learned that designing and building a high-performance, all-electric, solar-shingle home is a complex but rewarding process that depends heavily on early planning, careful site selection, and designing the house around the roof to maximize solar potential. Many were especially impressed by Tesla solar shingles—their aesthetics, ease of installation, snow-shedding advantages, and ability to provide full-roof coverage—along with supporting technologies such as air-to-water heat pumps, fan coil units, whole-house dehumidifiers, SPAN smart panels, Powerwalls, and detailed energy-use monitoring. Participants gained new insights into in-floor heating and cooling, humidity management, solar storage, electrification for decarbonization, and how solar shingles can offset lower efficiency by increasing roof coverage. They also valued the real-world case study and first-hand homeowner experience, which highlighted both the stress and the payoff of thoughtful, expert-guided design. Remaining questions and areas of curiosity focused on nuances such as floor cooling and humidity challenges, snow management on roof PV systems, code acceptance of certain ductwork designs, the role of specialists like CPHCs, long-term technology changes, and how to best evaluate ROI in relation to personal values rather than just financial metrics.

Q&A

How did the SPAN smart panel pay for itself? It made us aware that the backup boiler had become our primary source of heat – not the heat pump and that it needed to be adjusted or fine tuned. We use it to turn off our water heater (our third largest energy user) when we travel remotely and to also turn it back on before we return to have hot water when we get home!

What kind of shingles? Tesla Solar Shingles. Ours are 15” X 45”. Solar installations in 2023 nationally ranged between $2 to $4 per watt. Ours came in at $2.66.
URL versus QR Code for video: https://www.greenwaysolar.org/blog/forever-home-a-sustainable-oasis-in-lanesboro-minnesota
Slab on grade? No, we have a walk out basement with the same footprint of the house – 1,660 sq ft. Tesla batteries are recommended to be kept above 40 degrees fahrenheit. The basement is a great spot for that. Also note that the inverters give off heat which helps during the winter.We have them in a mechanical room with a separate door from the rest of the basement to minimize summer cooling load.
How much per square foot to build this house less the land please? We have a 1,660 sq ft home on a lot that was a composite of 7 smaller lots and is a combined 1.1 acres in size. This was ideal because it allowed us to position the home on the composite to capture the maximum solar potential of the site. Restored pollinator prairies have been re-established on our property and on the adjoining 2+ acres of city property where we removed invasives (buckthorn and honeysuckle).
Zehnder ERV questions: The tubes are a strong 3” in diameter and are used both for supply and return. I replace the small intake filter every 45 days during the summer and quarterly during the winter. The output filter every 6 months. These filters cost @ $25 each. The Zehnder ERV is much quieter than any other unit I am aware of.
How does your lifestyle change with this house? Do you watch weather more? Do you clean snow off the solar panels? Do you run the heat more before a storm to store temp before solar is covered with snow? We live a life of grace and gratitude. All our living space is essential on the main floor with no steps. It has reduced our annual living expenditure – we use export energy dollars to offset city sewer and water expenses. It has given us a sense of purpose and joy of being part of a larger energy efficient home community. The house essentially runs itself except for a semi-annual switch over between heating and cooling. Our battery automatically backs up to one hundred percent during NOAA severe weather alerts and is held there until the alert expires. The nice thing about infloor heat and cooling is that it holds room temperatures better than forced air systems. When you walk in the door, you notice the difference. Our favorite daily activity is to see who can guess most closely what our solar energy production for the day has been. Mary is usually within 10 kW/hrs
Solar panels versus shingles? I like the look of the shingles better. PV metal frames hold ice and snow. Shingles can cover the whole surface. We generate more than twice as much energy as our house uses with shingles already. Remember our system is rated at 32 kWs DC.
Did you use the same heat pump for your HVAC and DHW? No. We have a stand alone DNW, jacketed heater set up on limited use with the local utility.
Any Certifications? No
Would you share your housing plans? 
Yes, housing plans can be viewed here

Article based on webinar* 

Abstract

This article explores the design, construction, and real-world performance of an all-electric, solar-shingle home built in southeastern Minnesota using passive design principles, advanced electrification strategies, and distributed energy storage. The project demonstrates how architectural decisions, site optimization, mechanical systems, and energy management technology can be integrated into a resilient, comfortable, and highly productive residential energy system. Over three years of operational data reveal that the home ranks among the highest-performing solar roof systems in the country while maintaining occupant comfort, energy security, and environmental responsibility. The project also illustrates lessons for builders, contractors, designers, and sustainability professionals seeking to implement holistic, future-ready housing solutions.

Designing the House Around the Roof

One of the most unconventional — and ultimately decisive — design choices in this project was to design the house around the roof rather than designing the roof around the house. This reversal of conventional residential design thinking emerged from a commitment to maximize solar performance in a northern climate. In Minnesota, winter snow accumulation, low solar angles, and limited daylight hours demand roof geometry that sheds snow efficiently while maintaining high solar exposure in a time of low solar production and high energy demand.

The final solution was a two-pitch roof with a steep 10:12 slope oriented for optimal southern exposure. The roof contains no penetrations on its south face, preserving both watertight integrity and solar efficiency. Functional solar shingles occupy the central roof area, while non-generating “dummy” shingles frame the perimeter and overhangs for visual continuity and weather protection.

The result is a roof that not only generates energy but actively supports winter performance. After heavy snowfall, solar production resumes quickly because the steep pitch and thermal behavior of the shingles encourage snow shedding. This contrasts with conventional rack-mounted panels, which often remain snow-covered for extended periods in similar climates.

This approach demonstrates a crucial lesson for builders and designers: solar integration is not a technology add-on but a primary architectural driver. When solar is considered from the earliest design stage, structural, mechanical, and aesthetic systems align more naturally and efficiently .

Site Selection and Orientation

The project site was selected using satellite imagery and solar modeling to identify south-facing building opportunities within the desired community. Once a site was chosen, design software was used to position the structure for maximum solar access. This process ensured that roof planes, shading patterns, and seasonal sun angles were optimized before construction began.

Even existing vegetation was carefully considered. A large walnut tree on the western side of the site created late early-day shading on part of the roof, influencing roof layout decisions and system placement. Rather than removing the tree, the design balanced ecological preservation with energy performance.  (Note, we struggled to keep cars, equipment, construction materials, etc from being stacked over the tree’s root system attempting to preserve its health and vigor.)

This level of site-specific planning highlights an often-overlooked reality: energy performance is determined long before equipment is installed. Builders who ignore orientation and solar access leave performance on the table regardless of how advanced their technology becomes.

System Capacity and Energy Production

The home contains approximately 1,660 square feet of living space and 2,260 combined square feet of roof surface between the house and garage. The solar shingle system provides 32 kW of DC capacity and approximately 26.6 kW of AC output. Over three years of operation, the home has consistently ranked within the top one percent of solar roof producers and exporters nationwide.

Seasonal production follows expected patterns, with peak output in July and minimal output in December and January. However, the shoulder months — March, April, September, and October — demonstrate especially strong net export performance.

Annual performance data show that the home produces significantly more electricity than it consumes when vehicle charging is excluded. Even when vehicle charging is included, net export remains substantial. The system consistently supplies energy to the grid while maintaining household and transportation needs .

Energy Consumption Patterns

The home’s largest energy load is electric vehicle charging, followed by heating and cooling, and then domestic hot water. Vehicle charging averages approximately 450 kWh per month, costing roughly $46 at local electricity rates. This translates into a reliable, low-cost transportation energy model that eliminates fuel volatility and emissions while delivering daily convenience.

Heating and cooling costs average approximately $179 per month, despite Minnesota’s challenging climate. These results are made possible by a passive-inspired building envelope featuring high-performance insulation, airtight construction, and European-style fiberglass windows and doors. Builders reported noticeable warmth in the structure even before mechanical systems were fully operational.

The performance illustrates that electrification does not require excessive energy consumption when paired with envelope efficiency. Instead, the envelope becomes the primary energy system, with mechanical systems playing a supporting role.

Air-to-Water Heat Pump Strategy

The home uses an air-to-water heat pump rather than a conventional air-to-air system. Heating and cooling are delivered primarily through in-floor hydronic loops across five zones. This approach offers exceptional comfort, quiet operation, and uniform temperature distribution.

Cooling performance, however, required additional engineering refinement. In-floor cooling is constrained by indoor humidity because condensation risk rises when floor surface temperatures fall below the dew point. As humidity increases, control systems must raise water temperature, reducing cooling capacity.

To address this, a fan coil system was added upstream of the mixing valve, allowing 40-degree water to deliver additional cooling capacity when humidity loads increase due to occupancy or activity. This hybrid approach preserves radiant comfort while maintaining system stability.

The system demonstrates a critical insight for contractors: advanced heat pump strategies demand integrated humidity control, not just temperature control .

Air Quality and Filtration

Indoor air quality was treated as a primary health metric. The ventilation system uses small-duct distribution with multi-stage filtration, including HEPA and activated charcoal filters. Filters are easily replaceable, encouraging proper maintenance.

This system has proven particularly valuable during wildfire smoke events, when outdoor air quality deteriorates significantly. The ability to maintain clean indoor air while preserving energy efficiency highlights the growing intersection between sustainability and public health.

A whole-house dehumidifier further stabilizes indoor comfort, even though its acoustic presence remains noticeable in an otherwise quiet home. The tradeoff is considered worthwhile for long-term moisture management.  (Note: the whole house dehumidifier cycles frequently (large power demand) so we added a standard home dehumidifier to our system removing the majority of humidity with the whole house system cycling only to meet peak loads.  I hope this makes sense.)

Battery Storage and Smart Load Control

A 13.5 kWh battery provides daily load shifting and outage resilience. The battery is routinely discharged during peak household demand and recharged during solar production. During storm alerts, the system automatically returns to full charge to preserve backup readiness.

Power outages over three years totaled fewer than 70 minutes combined, yet the battery system demonstrated its value even during short interruptions. In one documented event, the battery recharged itself while the grid was down due to active solar production.

A smart electric panel enables remote circuit prioritization, allowing primary, secondary, and tertiary loads to be managed dynamically. Early performance data revealed that backup heating systems were consuming more energy than intended. Adjusting control settings based on real-time data significantly reduced consumption.

This illustrates a powerful principle: data transparency enables continuous optimization. Without granular feedback, inefficiencies remain invisible .

Distributed Energy as Infrastructure

The project treats distributed solar and storage not merely as household upgrades, but as infrastructure assets. Minnesota utilities now recognize that distributed generation and storage can be more cost-effective than centralized peaking plants. Incentives reflect this shift, including substantial battery rebates tied to grid support participation.

The home also anticipates vehicle-to-home and vehicle-to-grid integration, recognizing that automotive batteries represent a more economical storage resource than stationary systems. This strategy points toward a future in which homes, vehicles, and utilities operate as integrated energy ecosystems rather than isolated components .  (Note: this is something not commonly available but can be designed into new or rebuilt systems for future use.)

Construction Approach and Craft

The home was built by Amish craftsmen working alongside specialized HVAC and electrical contractors. While some subcontractors were initially hesitant to work with unfamiliar technologies, collaboration and shared learning ultimately produced a highly coordinated installation.

Solar shingles were installed in a day and a half by a certified crew, followed by electrical commissioning using tablet-based diagnostics to verify each shingle run. The precision and speed of installation demonstrated that advanced systems can be practical when teams are properly trained.

The project also incorporated reclaimed barn wood from a family farm, integrating cultural continuity with sustainable material reuse. Landscaping reused excavated stone and restored over three acres of prairie habitat, supporting stormwater management, biodiversity, and site resilience.

Water Management and Landscape Integration

Because the site sits on bedrock, stormwater management required creative engineering. A rain garden trench allows water to flow east or west while retaining runoff on site. This protects downhill neighbors and prevents erosion while supporting soil recharge.

Roof runoff from the solar shingles is directed into this system, integrating building and landscape into a unified hydrologic strategy. This reinforces the principle that sustainability extends beyond energy into ecological stewardship.

Rethinking Return on Investment

Questions about financial return are inevitable. Solar shingles in 2022 ranged from approximately $2 to $4 per watt, with this system installed at roughly $2.66 per watt.

However, financial ROI alone fails to capture resilience, comfort, health, energy security, and climate risk mitigation. The project reframes value as continuity of function during outages, freedom from fuel volatility, long-term operating stability, and contribution to climate responsibility.

In this context, sustainability is not a luxury feature but a form of risk management.

Collaboration as a Design Method

More than twenty contributors shaped the final design, including architects, engineers, energy modelers, builders, and experienced homeowners. This distributed knowledge model proved more effective than relying on any single discipline.

The project underscores that future-ready housing is a collaborative endeavor. No individual professional holds all necessary expertise. Integration, not specialization, defines success.

Implications for Builders and Professionals

This project demonstrates that:

  • All-electric homes perform exceptionally well in cold climates when properly designed.
    • Solar shingles can rival or exceed conventional panel systems when integrated architecturally.
    • Air-to-water heat pumps are viable but infloor cooling requires humidity-aware design.
    • Battery storage adds operational intelligence, not just backup power.
    • Smart panels enable behavioral and system optimization.
    • Landscape design is inseparable from building sustainability.
    • Collaboration reduces risk and increases innovation.

Together, these lessons form a blueprint for future residential construction that is resilient, efficient, and human-centered.

Conclusion

The all-electric, solar-shingle, Amish-built forever home represents more than a technical achievement. It is a systems-thinking demonstration of how architecture, energy, comfort, health, and ecology can be unified into a single residential model.

Rather than chasing individual technologies, the project pursued coherence. That coherence is what produced top-tier energy performance, occupant satisfaction, and long-term resilience.

For sustainability professionals, builders, and designers, this project confirms that the future of housing is not about isolated upgrades. It is about integrated intention.

Green Home Institute continues to highlight projects that prove sustainable design is not theoretical — it is livable, practical, and ready now.

Key Takeaways

    • Designing around solar geometry significantly improves long-term performance.
    • Passive envelope strategies remain the foundation of electrified homes.
    • Air-to-water heat pumps Infloor cooling requires integrated humidity management.
    • Battery systems provide optimization and resilience, not just backup.
    • Smart electrical panels enable continuous performance tuning.
    • Distributed energy systems strengthen grid resilience.
    • Landscape and water management are core sustainability systems.
    • Collaboration across disciplines drives superior outcomes.
    • Sustainability delivers value beyond financial ROI alone.
*Content created by a human speaker, transcribed by Zoom, and arranged by ChatGPT
Categories
Guest Articles

Water Stewardship in Modern Homes: Tips, Tech, and Trends for 2026

Water Stewardship in Modern Homes: Tips, Tech, and Trends for 2026


Water stewardship is a baseline expectation for green home work across North America. It affects plumbing choices, construction details, landscaping and ongoing service. For builders, renovators and trade partners, the goal is to reduce avoidable water loss and support healthier indoor systems. The most successful projects treat water as a design system that’s planned early, verified and supported with homeowner routines that keep performance visible over time.  

The Strain on North America’s Water Systems

Public drinking water networks across the U.S. and Canada are dealing with aging pipes, deferred upgrades and rising cost pressures. Millions of lead service lines remain in place, and recent federal needs assessments indicate billions in required investment over the coming decades. Those figures reinforce why home-side water management matters alongside municipal work. 


Climate stress adds a second layer, with longer and hotter dry spells reducing supply reliability, and major storms and flood events overloading collecting and treatment capacity. When systems designed for historical weather patterns face today’s volatility, asset damage and service interruptions become harder to prevent. 


These constraints create a new urgency inside the property line. Residential projects that reduce demand, detect loss early and reuse suitable water can lower the load on municipal networks, while helping homeowners maintain daily needs. 

Key Tech Trends in Residential Water Management

Residential water tech for 2026 is getting more precise and easier to integrate into standard renovation scopes. Many of the most valuable upgrades improve visibility and control, helping homes reduce waste, catch leaks early and stay more resilient through local supply shifts. 

1. Intelligent Leak Detection and Monitoring

Smart monitors and advanced meters are increasingly being installed as part of renovation projects, especially where insurers, property managers or municipalities encourage loss prevention. The best setups provide real-time flow visibility, appliance-level pattern recognition and automated shut-off options when abnormal usage surfaces.


Leak reduction is also now a measurable outcome. Many public agencies highlight leak waste at a national level, which helps justify the return-on-investment conversation during proposals. For example, Pennsylvania’s utility regulator points to near-trillion-gallon annual losses tied to household leaks nationwide, highlighting the value of detection and prompt repair. 

2. High-Efficiency Fixtures and Appliances

The Environmental Protection Agency’s WaterSense program continues to support specs that reduce water use without sacrificing function. This is helping professionals make upgrades feel like a quality improvement rather than an expense. Old toilet systems, for instance, use up to six gallons of water with every flush, accounting for almost 30% of a typical home’s average indoor water usage. Modern systems can now use only 1.28 gallons per flush. 


Appliance selection also matters. Dishwashers and laundry machines are being evaluated alongside fixture packages, especially in high-occupancy homes and multifamily retrofits. The Department of Energy’s consumer guidance makes the case for modern dishwashers that use less water than handwashing under many real-world conditions. The agency also reinforces the value of right-sizing, proper loading and cycle selection to avoid waste. 

3. On-Site Water Recycling Systems

Greywater, or on-site water reuse, is gaining more attention because it directly offsets potable water demand for non-drinking uses, such as irrigation and toilet flushing. Policy and program conversations increasingly frame water reuse as a supply resilience tool, including building-scale greywater approaches where codes allow. 


In states with active reuse practices, the fit-for-purpose design is popular — treat water to the level needed for end use, then verify with appropriate safeguards. California regulators, for example, are actively addressing on-site treated nonpotable reuse strategies, including collecting rainwater and stormwater and using greywater for landscaping.  


Atmospheric water generation is also being considered for specific contexts, such as arid regions, remote properties or resilience-focused projects. Researchers have demonstrated higher-yield approaches for pulling water from low-humidity air, though this is a work in progress as energy inputs, maintenance and realistic daily output still require careful sizing. 

Sustainable Practices for the Modern Green Home

Technology helps, but many of the biggest water gains come from design choices that lower demand in the first place. Planning for rain capture, irrigation and plant selection can reduce outdoor water use while keeping landscapes durable across the weather patterns North American regions are already experiencing. 

Rainwater Harvesting Integration

Rain barrels remain common, but more projects are moving toward covered cisterns, filtration and pump packages that feed irrigation or other non-drinking uses. Health and handling guidance matters, particularly for storage design, mosquito control and cross-connection prevention. 


The Centers for Disease Control and Prevention notes practical considerations to help keep water collection installations safer and easier to maintain. The best installations are those that treat rainwater as part of plumbing planning, so the system remains workable long after the project is done. 

Climate-Adapted Landscaping

Xeriscaping is another climate-fit design. Across North America, drought tolerance and low-water planting are going mainstream in both new construction and remodeling projects. Research emphasizes plant selection suited to the local climate, soil improvements and irrigation design that reduces overspray and evaporation. 


This approach supports different aesthetics, from pollinator-focused gardens to modern native plant palettes. It also aligns with drip irrigation, soil moisture monitoring and seasonal reset schedules so outdoor water use stays predictable. 

Creating a Holistic Water Stewardship Plan

In 2026, having a water-smart home means relying less on a single machine and more on making strategic choices. Monitoring detects leaks early, high-efficiency fixtures reduce daily demand, and reuse or harvesting can meet non-potable needs. Climate-adapted landscapes can also reduce outdoor usage while protecting curb appeal. When professionals deliver these elements as one plan, homeowners become more responsible users when municipal supplies are strained by storms, droughts or aging infrastructure. 


Categories
Uncategorized

Retaining Walls and Embodied Energy: Comparing Natural Stone, Concrete Block and Alternatives


https://unsplash.com/photos/green-leafed-trees-and-plants-beside-chain-fence-pe7h-dCPT4k


Retaining walls have changed in structure, material and integrity over the years, as environmental, aesthetic and practical needs have shifted. However, making the practice greener has become a more prominent priority in recent years, requiring engineers and builders alike to consider key parameters like embodied energy and recyclability. How do the most common materials compare to one another when observing their life cycle — including harvesting, maintenance and disposal?

A Life Cycle Comparison of Retaining Wall Materials

Here is a look at the most popular materials used in retaining walls, evaluated based on their embodied carbon, and how maintenance needs and longevity impact their life cycle assessment, which covers 30-50 years.


Material

Embodied Energy

Durability and Lifespan

Environmental Impact and Carbon Footprint

Maintenance Demands

Natural stone

Low because of heavy reliance on natural processes, but higher when considering transportation

50-75 years

Low to moderate based on the intensity of quarrying and transportation, but can incorporate reused materials and local assets

Minimal if provided adequate drainage

Concrete

High due to high energy requirements and intensive mining

50-75 years

High because of high-temperature manufacturing and the carbon footprint of cement

Medium if cracking appears

Gabion baskets

Low to moderate, depending on wire materials and cage contents

50-75 years

Low if the wire mesh is made sustainably and the cage is filled with low-carbon materials like local stone or recycled tires

Minimal if corrosion prevention strategies are used

Engineered timber

Low because of renewability and lower processing temperatures

30-35 years

Moderate due to deterrents like chemical use, but benefits like carbon sequestration

High due to frequent inspections and finishings

Recycled options

Very low, even for recycled cement

Varies based on material

Very low, depending on the materials, as it can prevent landfill waste and cut energy from virgin material processing

Varies based on material and composition

Analyzing the Most Sustainable Retaining Wall Options

https://unsplash.com/photos/stone-wall-with-plants-in-the-foreground-f7poIvVWtfg


By the numbers, the most eco-conscious options are gabion baskets and recycled alternatives. They have a long shelf life, while requiring low processing and minimizing stress on transportation systems. If materials are repeatedly cycled through the economy, then their life cycle assessment becomes greener after each use case. However, there are several nuances to consider.


The longer a retaining wall stands without replacements or repairs, the better it is for the planet. Natural stone, if sourced locally to minimize transportation emissions, may be a better long-term option compared to alternatives due to its resistance to the elements. Options, like concrete and timber, may be cheaper, but they need replacing more frequently, adding to their adverse impact.


Stakeholders should also consider how a material provides other sustainability benefits in the area. Investing in outdoor features can also reduce the carbon footprint of nearby households by protecting them against climate stressors, while increasing property value. Efforts like landscaping — which may include hardscaping fixtures such as retaining walls as protective or decorative features — could boost the price by 5.5% to 12.7% if they appeal to the design preferences of modern buyers.


All retaining walls support climate mitigation, helping to stave off the negative effects of environmental damage and rising temperatures. Some variants, like living walls, can also incorporate organic materials to restore nature while providing the benefits of conventional retaining structures. Nature-based solutions are inherently more sustainable, as they offset some of the embodied energy associated with a material’s acquisition or transportation.


Choosing more sustainable materials should be the direction experts move in. However, vegetated or living retaining walls could move civil engineering in a new direction. They incorporate more robust environmental considerations into the planning stages as they collaborate with other specialists, such as soil experts or geoengineers. Using natural additives or vegetation may also be combined with other materials, such as concrete blocks, to enhance their ecological benefits while mitigating mechanical drawbacks.

Embracing a Life Cycle Approach

https://unsplash.com/photos/tiered-gardens-with-stone-architecture-and-vibrant-flowers-znIyXn4B-sQ

Ultimately, there is a way to make each material more sustainable for retaining walls. Experts can utilize new technologies — such as low-carbon, self-healing concrete — to reduce emissions. They can use sealants to increase the lifespan of timber. Professionals may also leverage nature-based or recycled solutions to support a circular economy.


Diverse solutions are necessary to support the supply chain for retaining walls, and every effort to decarbonize matters. Eventually, experts will begin defaulting to more eco-conscious options, which will help retaining walls become dependable fixtures for climate mitigation and environmental control.


Author


Grace Waters

Always inspired by the natural world around her, Grace grew up

 exploring tide pools and hiking mountain trails, developing a deep appreciation for biodiversity and conservation. Now, Grace works as the Senior Editor of Environment.co where she covers topics related to emerging clean technologies, zero-waste initiatives, and the intersection of environmental policy and everyday living.


Categories
Q&A Webinar After

The “Very Best” from the Visible Green Home® Tour Series Article & Q&A

Michael Klement and the Architectural Resource Team joined us for our  Weekly Wednesday Free CEU webinar Series.

If you missed this session, want to rewatch it, or share it with a friend or colleague, you can now do so, as the recording and article on the topic are available below. 

Overall, respondents said they learned a great deal about high-performance building assemblies, especially double-stud and double-layer wall systems, exterior and interior air barriers, vapor and water control layers, and the principle that air and water control matter more than R-value alone (“water always wins”). Many highlighted specific products and details they had not seen before—ZIP sheathing used in unconventional locations, Dens Element, Warm Form, mineral wool and wood fiber boards, expanding foam tapes (including handling tips), Hanno tape, bird-safe glass, corrugated plastic for bulk water drainage, floating mat foundations, permanent wood foundations (PWFs), and insulated concrete forms. Attendees also appreciated practical enclosure details such as window flashing, deep jamb extensions, staggered insulation seams, attic air-barrier continuity, and drip-edge placement. For experienced participants, the session served as a useful confirmation or refresher, while newer attendees found the range of projects and techniques inspiring. Remaining questions and gaps centered less on basic concepts and more on context-specific application—how these assemblies perform in different climates (especially fire-prone dry regions), cost and material tradeoffs, durability claims (e.g., longevity of PWFs), and detailed execution choices (attic boundary decisions, window vapor management, siding interfaces). A few respondents also noted presentation format issues (AV and video in a webinar setting) that made it harder to absorb the content.

Q&A

Q: Are these good details that we can reference when incorporating these concepts into our own drawings?
A: It depends on your climate zone! We are in climate zone 5 – and these details would certainly work anywhere within that climate zone. You want to be careful to have the correct relationship between exterior and interior insulation depending on your climate zone.

A: You would just want to be careful up North (Northern Lower and Upper Peninsular) where we get into climate zone 6. So far we have been looking at pretty robust exterior insulation so these would likely be fine – but if you were doing less exterior insulation you could run into an issue.

Q: On the insulation, can you repeat the thickness of each layer of exterior insulation or the total thickness that you are comfortable with installing from a structural siding installation standpoint?
A: From outside to inside under the rainscreen, the wall has a 2” layer of paper-faced polyiso, a 1 1/2” layer of the same (staggered), 7/16” zip (taped), 2×6 walls filled with dense packed cellulose, and then drywall.

Q: Regarding the FPSF system: can you speak to the science behind the system that prevents it from heaving from the freeze/thaw cycle in the southeast Michigan climate?
A: A horizontal rigid insulation apron surrounds the perimeter of the home, the perimeter of the FPSF. This helps the warmth from the ground to be contained and assists in preventing frost heave.

A: The idea is that the soil under the building never gets to below freezing temps. The building heat loss along with the geothermal heat in the soil keeps the soil temperatures above freezing. I believe an 1” of insulation is something like a foot of soil equivalent or so a few inches of well placed insulation goes a long way to keeping the soil warm.

Here is some additional information:
https://www.nachi.org/frost-protected-shallow-foundation-fpsf.htm

Q: It is not clear to me if attic is vented or not for 1st case
A: It was a vented attic. Our apologies, there was a technical difficulty that caused our answer to go into the chat.

Q: What is the advantage of expansion tape over spray foam at window shim space?
A: Expanding tape is easier and more precise to apply for our builders, but just as important is that it leads to a healthier environment by cutting out the VOC’s typically released by spray foam.

Q: If Kusano attic is vented, how you can store stuff there?
A: Zoran, for the Kusano project, there were two attics. One was entirely within the thermal envelope and items could be stored there. Above this lower attic is the main upper attic, and it has 30” of insulation, and storage was not a component of that attic.

Q: How’d you get the insulation in behind the DensElement? What type of insulation did you use?
A: We had a double-stud wall interior to the DensElement, and that assembly has dense-packed fiberglass. We used OwensCorning ProPink.

Q: What climate zone is this house in? An interesting ratio of inboard/outboard insulation!
A: This project is in Washtenaw County MI, Zone 5A.

Q: What climate zone is this house in? An interesting ratio of inboard/outboard insulation!
A: Anna – Could you elaborate on what you find interesting on the insulation strategy?

Q: But how did you get the fiberglass in? You had a sealed zip layer and then the DensElement. If you dense-packed you must have put holes in one side or the other, or there was an additional membrane under the DensElement.
A: If memory serves the builder installed the dense-packed fiberglass from the inside interior to the zip and from the outside exterior to the zip by using the DensElement to create the cavity with the very top sliver of the DensElement put on last.

Q: Did you use suntubes on the roof?
A: Yes!

Q: Can you talk about managing the insulation of them or condensation?
A: Elisa – this is an excellent point! Condensation will form on the metal tube material for the solar tubes unless they are wrapped with insulation. This can be a little tricky because they often jig and jog to get where they want to go on the interior and exterior. If there is closed cell spray foam used on the project that can work well. If you want to avoid foam, it can absolutely still be done but just requires careful installation to make sure its continuous.

Q: Thanks for this webinar, are you beginning to research how affordable homes can tap into your sustainable strategies?
A: We definitely are! We have a template home that we have developed that looks at ways to bring the cost down in a repeatable way, and we are always looking at this question.

Article based on webinar 

The Very Best of Green Living: Demonstrating the Best Features of High-Performance Green Building

Abstract

High-performance green homes are not created through a single product choice or certification label. They are the result of a disciplined, integrated approach to building science, moisture management, durability, energy conservation, and human comfort. This article explores the best features of green building through real high-performance residential projects, illustrating how thoughtful design decisions—made from the foundation to the roof—can dramatically reduce energy use, increase resilience, extend building life, and improve occupant health. The focus is not on theoretical ideals, but on proven construction strategies that show how sustainable homes can be practical, buildable, and replicable.

Introduction: Green Building as a System, Not a Checklist

The best green homes are not assembled from isolated “eco-friendly” components. They are systems—where structure, enclosure, mechanical systems, materials, and human needs are addressed together. When sustainability is treated as a system, design decisions become more than stylistic preferences; they become tools that solve multiple problems at once.

High-performance green homes consistently demonstrate that durability, comfort, energy efficiency, and environmental responsibility are deeply interconnected. Water management, air control, vapor control, thermal continuity, and ventilation are not independent ideas. They must work together, in sequence, and with discipline.

This integrated mindset allows homes to use dramatically less energy than conventional construction while also achieving better indoor air quality, longer service life, and improved resilience in challenging site conditions.

The Four Control Layers: The Foundation of Performance

Every high-performance wall relies on four essential control layers: bulk water, air, vapor, and thermal. These layers must be designed and installed in the correct order, because failure in any one layer compromises the others.

In modern high-performance assemblies, taped structural sheathing often serves as the primary air and vapor control layer, creating a continuous barrier that prevents convective heat loss. Exterior continuous insulation then becomes the first major thermal layer, reducing thermal bridging and improving overall wall performance.

By staggering insulation seams and creating ventilated rain-screen cavities behind siding, the wall assembly allows both drainage and drying, increasing durability while maintaining energy efficiency. This layered approach ensures that moisture does not accumulate, air does not leak, and heat does not escape unnecessarily.

Green building succeeds when assemblies are designed to fail safely—acknowledging that water will always find a way—and when drying potential is built into the system rather than treated as an afterthought.

Designing to Control Water First

Water is the primary enemy of durability. Bulk water management must be addressed before energy performance can even be discussed. Proper flashing, drainage planes, sill pans, and drip edges are not details—they are core performance features.

High-performance assemblies intentionally direct water “down, out, and away,” using gravity and capillary breaks to prevent moisture from re-entering the building. Through-wall flashing, drip edges, and ventilated drainage cavities work together so that any water that enters the assembly is safely expelled.

This philosophy treats water not as a rare accident, but as an expected condition. By assuming water intrusion will occur, designers create assemblies that remain durable even under failure scenarios.

Design Effectiveness: One Solution, Multiple Benefits

A defining characteristic of green building excellence is design effectiveness—using one design decision to solve multiple problems.

In hydric soil conditions with high groundwater, traditional deep foundations introduce unnecessary risk and cost. A floating mat foundation, built over crushed stone and thick layers of insulation, avoids deep excavation while creating a frost-protected shallow foundation. This approach not only resolves soil and groundwater challenges, but also creates a thermal battery, absorbing passive solar heat during the day and releasing it slowly into the home at night.

This same foundation simultaneously addresses structural stability, moisture risk, thermal performance, and energy storage. This is what sustainable design looks like when done well: fewer materials, fewer complications, and more performance from each decision.

High-Performance Windows as Thermal Components

Windows are often the weakest link in conventional homes. In high-performance homes, they are treated as precision thermal components.

Triple-glazed passive-house windows with thermally broken frames reduce energy loss while improving comfort. Instead of being installed at the exterior plane of the wall, these windows are positioned within the center of the thermal profile, minimizing thermal bridging.

Expandable perimeter tapes replace traditional foams and sealants, creating continuous air and vapor control at the window opening while allowing precise alignment during installation. Over time, these tapes expand to fill gaps completely, maintaining airtightness and durability.

This level of detail ensures that windows no longer represent energy liabilities, but instead become integral contributors to enclosure performance.

Insulation Continuity and the “Good Hat”

High-performance homes demand uninterrupted insulation. Roof assemblies, in particular, must maintain continuous coverage without compression or gaps.

Deep heel trusses allow for thick attic insulation blankets, creating consistent R-values across the entire ceiling plane. This continuity ensures that warm air does not escape at the roof edge, a common failure point in conventional construction.

By treating the roof as the “hat” of the building and the foundation as its “boots,” designers emphasize the importance of enclosure continuity from bottom to top. A home cannot perform well if either end of the enclosure is compromised.

Double-Stud Walls: High R-Value with Moisture Resilience

Double-stud wall assemblies provide exceptionally high insulation capacity while reducing thermal bridging. In this configuration, the structural wall remains inside, while a second stud wall is constructed outside of the air control layer, creating a deep cavity for insulation.

By placing the air barrier at the center of the assembly and offsetting the exterior framing, heat flow is significantly reduced. This configuration also allows for careful moisture control when paired with vapor-open exterior materials.

DensElement sheathing plays a critical role here. Acting as both weather-resistant barrier and air barrier, it eliminates extra installation steps while offering an extremely high vapor permeability rating. This allows high-R assemblies to dry both inward and outward, significantly reducing moisture risk.

Drainage matrices behind siding further enhance durability by providing a three-dimensional air and water pathway, ensuring that any moisture behind the cladding can safely drain and dry.

This type of assembly demonstrates that high insulation values and moisture safety are not mutually exclusive when properly designed.

Foundation Performance Below Grade

Green building does not stop at the soil line. Below-grade walls and slabs are critical parts of the enclosure.

Insulated concrete forms combined with exterior insulation and interior stud cavities create foundation walls with R-values far exceeding code requirements. Slab assemblies incorporate continuous vapor barriers, layered insulation, and deep drainage stone to manage both heat loss and groundwater pressure.

These strategies prevent moisture migration, improve comfort, and dramatically reduce energy loss through the foundation—an area often neglected in conventional construction.

Airtightness and Ventilation: Build Tight, Ventilate Right

High-performance homes are intentionally airtight. This is not a flaw; it is a requirement.

Conventional homes leak massive volumes of conditioned air, effectively wasting energy while allowing uncontrolled pollutants to enter. High-performance homes replace this randomness with controlled mechanical ventilation.

Energy Recovery Ventilators (ERVs) remove stale, humid air from kitchens, bathrooms, and laundry areas while bringing in fresh outdoor air. Heat and moisture are transferred from outgoing air to incoming air, recovering up to 90% of the energy.

This approach ensures consistent indoor air quality without sacrificing efficiency. The house itself does not “breathe”; people do. Mechanical ventilation allows homes to serve people rather than fight physics.

Form Follows Function: Solar-Driven Architecture

Roof shapes and orientations are not aesthetic afterthoughts. They are functional tools.

By studying solar access early in the design process, roof forms are shaped specifically to support photovoltaic systems. Simple roof geometries maximize panel efficiency while minimizing structural complexity.

This approach avoids the common mistake of designing complex roofs first and attempting to retrofit solar later. Instead, solar performance drives architectural form.

Long Life, Loose Fit: Sustainability Beyond Energy

True sustainability considers how long a home remains useful.

The “long life, loose fit” philosophy recognizes that occupants change over time. Mobility needs evolve. Families grow and shrink. A home that cannot adapt is not truly sustainable.

Design strategies such as residential elevators, flexible layouts, and structural allowances for future modifications ensure that homes remain usable across decades. Accessibility becomes a sustainability feature, not merely a convenience.

Similarly, “future-ready” design anticipates later upgrades. Elevator shafts designed as closets today can become functional mobility solutions tomorrow without major structural disruption.

Sustainability is not only about kilowatt-hours. It is about ensuring that homes continue serving people without demolition and rebuilding.

Reducing Embodied Carbon: Permanent Wood Foundations

Concrete is one of the highest embodied-carbon materials in construction. Reducing its use has a significant environmental impact.

Permanent wood foundations replace concrete footings and walls with pressure-treated wood assemblies supported by gravel footings. These systems are engineered for moisture resistance, longevity, and structural performance.

Testing shows these foundations have remained stable for over 70 years, with projections extending far beyond that.

By eliminating large volumes of concrete, these foundations dramatically reduce embodied carbon while maintaining durability.

Sustainability Beyond Energy: Bird-Safe Glass

Green building also includes ecological responsibility beyond human comfort.

Large glass areas contribute to bird fatalities during migration. Bird-safe glass incorporates subtle patterns visible to birds but nearly invisible to humans, significantly reducing collisions.

This strategy illustrates a broader sustainability mindset: protecting ecosystems as part of responsible building design.

Conclusion: The Best of Green Living

The very best of green living is not defined by labels, certifications, or isolated technologies. It is defined by a commitment to integrated thinking, disciplined detailing, and respect for both physics and people.

High-performance green homes demonstrate that it is possible to build structures that are comfortable, resilient, adaptable, and deeply responsible to both occupants and the environment. When design decisions are made with intention, each layer of the building becomes part of a coherent system—working together to create homes that truly represent the future of sustainable living.

The Green Home Institute continues to support this mission by empowering professionals and homeowners to understand, apply, and advance these principles.

Key Takeaways

  • High-performance green homes rely on integrated systems, not isolated products.
  • Water management is the first priority in durable design.
  • Continuous air, vapor, and thermal control layers are essential for performance.
  • Double-stud walls and vapor-open materials enable high R-values with moisture safety.
  • Mechanical ventilation replaces uncontrolled air leakage with healthy airflow.
  • Roof forms should be driven by solar access and energy goals.
  • Long-life, adaptable design is a core sustainability strategy.
  • Permanent wood foundations significantly reduce embodied carbon.
  • Bird-safe glass reflects ecological responsibility beyond human comfort.
  • The best green homes are those that balance performance, durability, adaptability, and environmental stewardship.
Content editing was done by ChatGPT and Zoom