The short answer is it did slightly, but my goals for my solar system were still met. But how did I figure that out?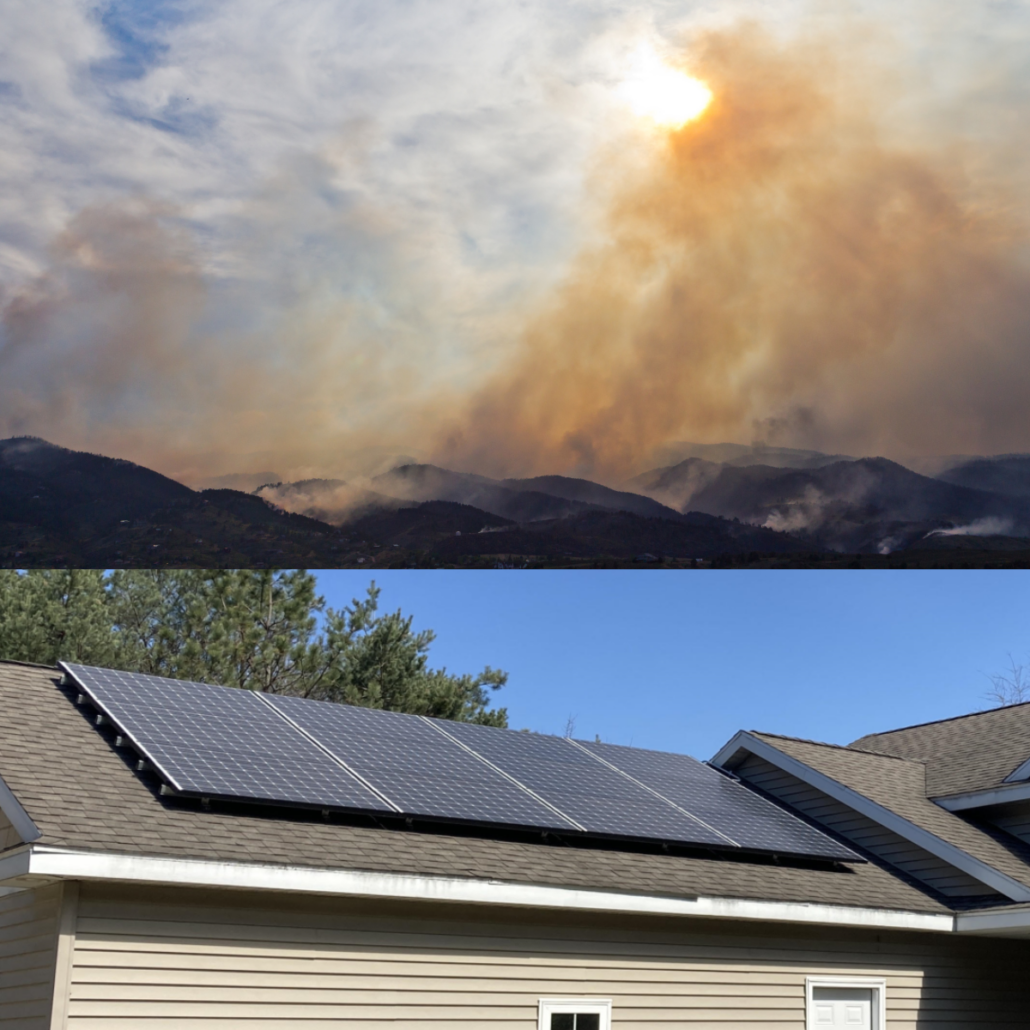
We know that cloud coverage reduces solar power. When a system is designed and installed, the solar installers account for average to worst-case cloud coverage, which is built into the energy production model. So there should be no surprise or question about cloud coverage reducing solar. It is totally normal, but now should installers be accounting for wildfire smoke (and apparently Sarahn dust storm?) events?
We sadly got to give this a test in Michigan, where we, up until the 2020s, got few wildfire smoke issues. The worst so far has been the month of June—specifically the last week. A steady haze from the Canadian wildfire smoke sat over our area. I observed it frequently just by seeing thin fog daily, a more orange sun, and then by checking my EPA AirNow air quality App, which bounced mostly yellow (Moderate ) to orange (unhealthy for sensitive) once and a while every day and throughout each day. The app detects ozone issues which is not a problem for solar, but the concern is the PM2.5 or particulate matter, which was tracking higher than normal and causing the sun to diminish.
So before we can know how much the smoke was blocking the solar, I needed to know the % of sunny days vs cloudy days and the cooling degree days, and what the solar projections are for my system in the month of June. Obviously, on the first question, if it was just cloudy, it would block the sun, and on the 2nd, if it was hotter than normal, it would diminish the output of the solar as well.
Grand Rapids National Weather Service has a sunshine tracker which tracks the daily sun, and so once they updated it for June, I could take a look. I asked them if this sun tracker was impacted by wildfire smoke, making it think it was a cloudy day.
“Yes, the smoke did impact the sensor readings to a degree. Basically, whenever shadows are cast, the sensor accumulates the minutes of sunshine. If enough smoke obscures the sky even with no cloud cover, the sensor will show less minutes observed than what normally would occur. This is especially true early in the morning and late in the evening with a more shallow sun angle, which has to cut through a greater degree of smoke. I don’t have a hard metric for you on what the reduction would be.”
Essentially wildfire smoke will increase our reduction in sunshine days as time goes on.
Next, I used degreedays.net to check cooling degree days which may tell me how hot it was and if that diminished the solar output.
Lastly, I looked at my solar installers’ projections for June, and by the way, their projections are only good for a year. Most systems, I am told, are supposed to lose 20% efficiency in the second year, and so on. Again, the total normal
Lastly, I compared solar generation, sunny days, and Cooling Degree Days (CDD) on June 22, 21, and May 23, 22 to see how it all compares. Overall cooling degree days held steady in June between weeks and stayed as warm as average Junes in the last few years.
The last week of June was the smokiest. We had to stay indoors mostly. The levels on the IAQ were ready in red and purple for most of the week, so this was the thickest cloud coverage. Most of the weather forecast for that week called for sunny days. However, the Grand Rapids solar observer reported it was mostly cloudy because smoke blocked it. The smoke made it report that the last week in June was 50% more cloudy than the rest of the month.
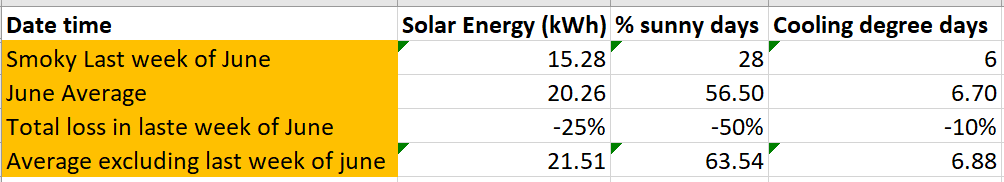
This resulted in a 25% reduction in solar energy compared to the rest of the month.
Then if you look at solar data for June going back to 1950, the average has been 64% sunny days. So if you look at the data, this June was on track for hitting the average even with it being slightly smoky all month. Still, the last week, when the real heavy smoke blew in, it dropped to an 8% loss compared to the average, which correlated to a 3% loss in solar power compared to the average projection for my solar system.
After doing this review, what really stuck out to me was looking back at 2021. Significantly hotter and significantly more cloudy than average and the worse solar performance despite the system just being installed in Feb 2021.
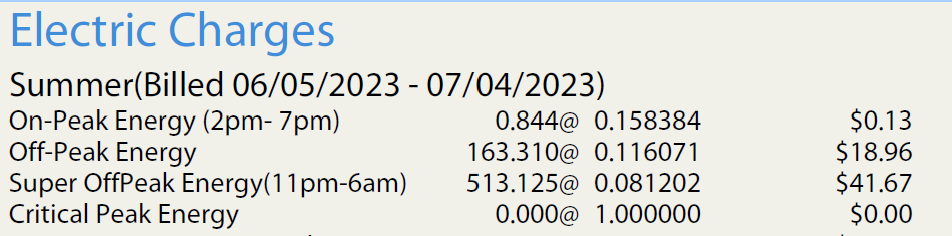
So, in summary, wildfire smoke and heat are guaranteed in our future, and it does impact solar power generation, but despite that, my goal of staying off-peak with less than 1 kwh out of 677 being used during peak for the entire month. This leads me to believe solar is still resilient despite wildfire smoke and is an effective way to power our homes in the future.
Learn more here about Brett’s Green Home Renovation and how you can too