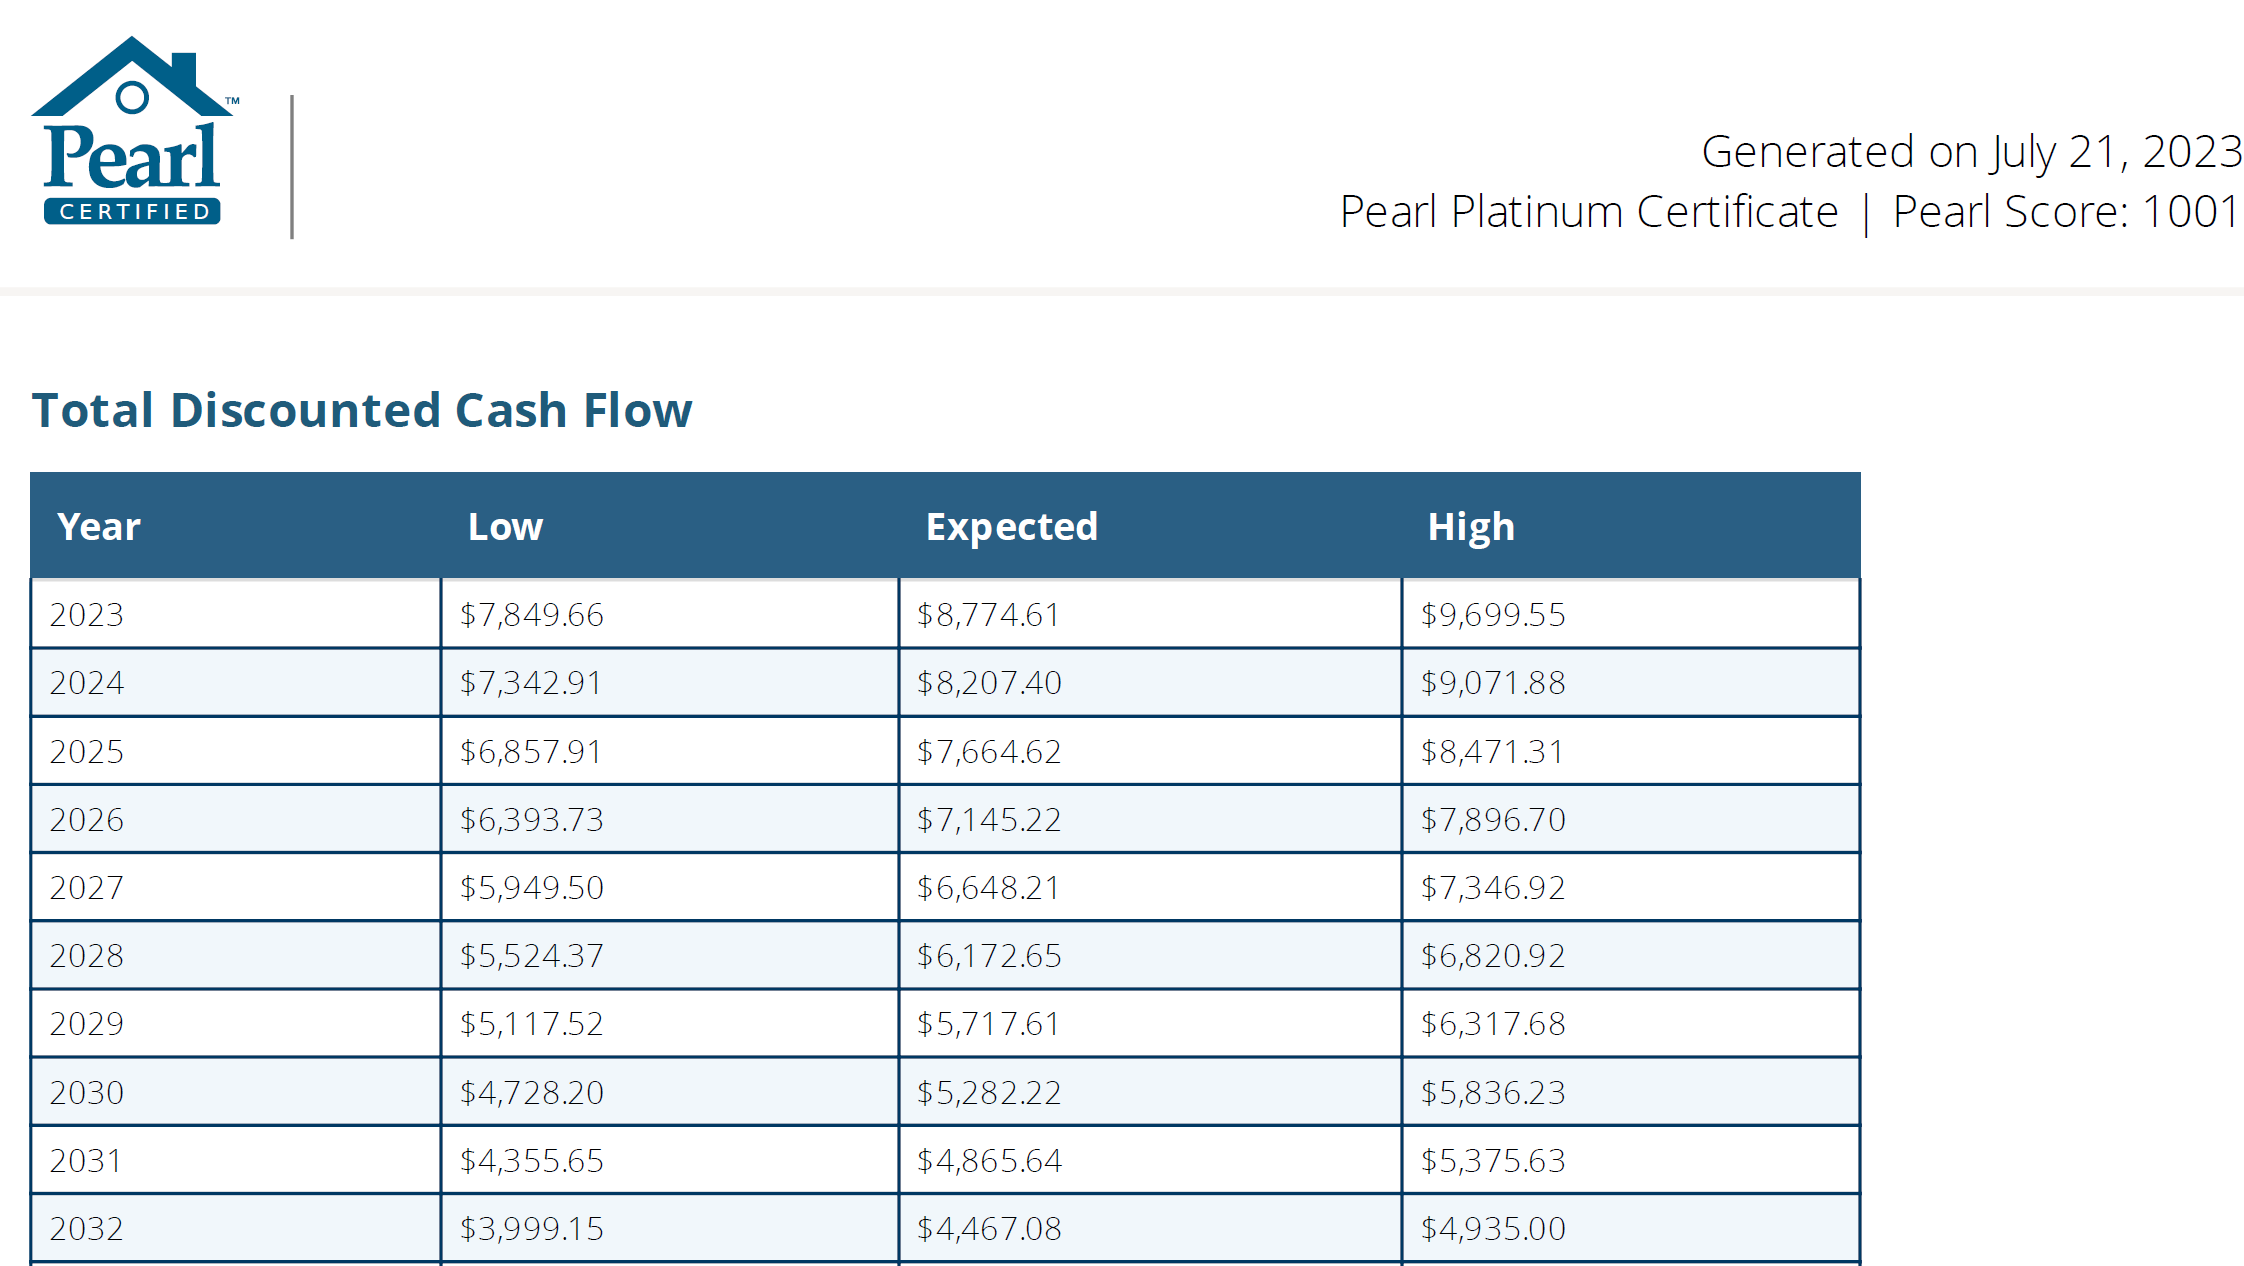
GHI Education manager documents home energy and air quality data during heatwave

The heatwave here in Michigan has seemed to die down finally. How did my house fair throughout it?

Our goals were to stay safe and comfortable while shifting energy use off the 2 – 7 pm peak times. How did we do?  

The heatwave lasted from Monday the 17th through Saturday the 22nd, with heat indexes going into 90 – 95 and temperatures staying in the 80s at night.

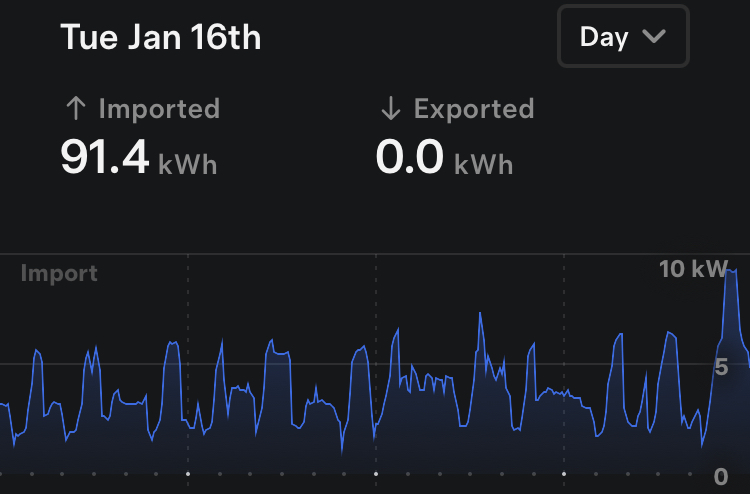
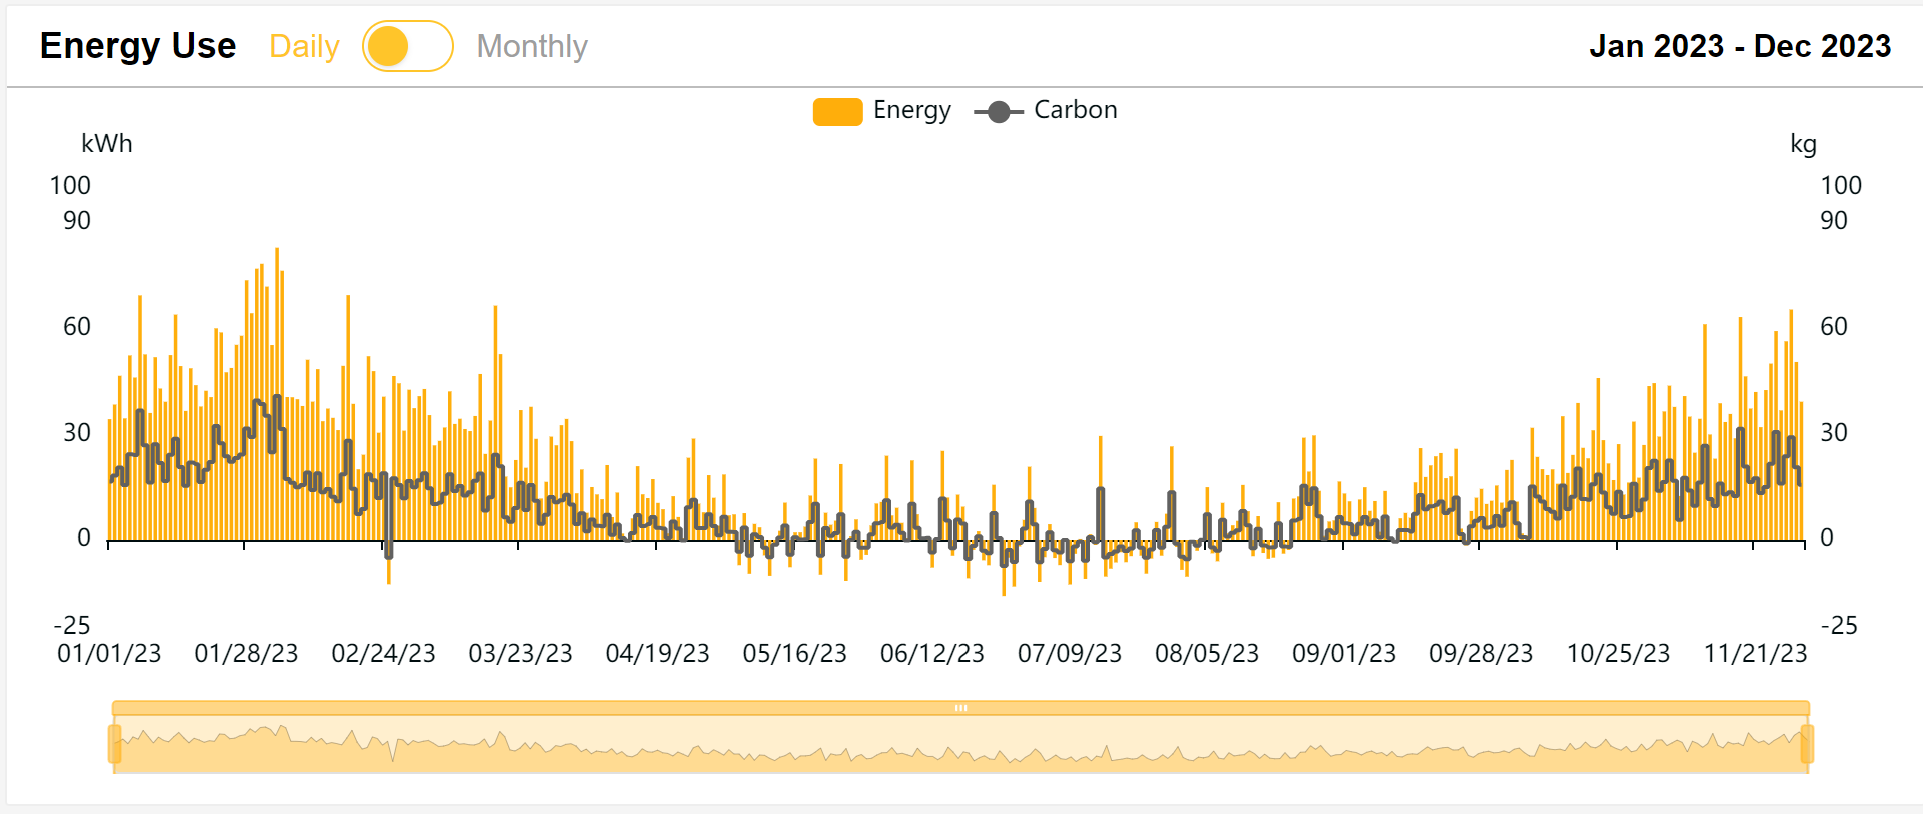
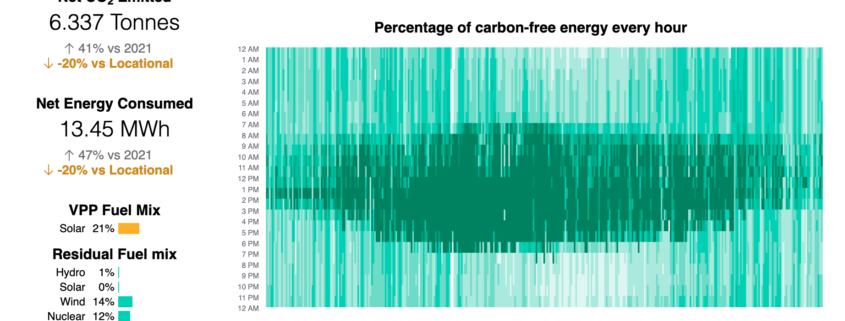
I determined these data points using real-time air quality and energy monitoring compared to the previous week in June.

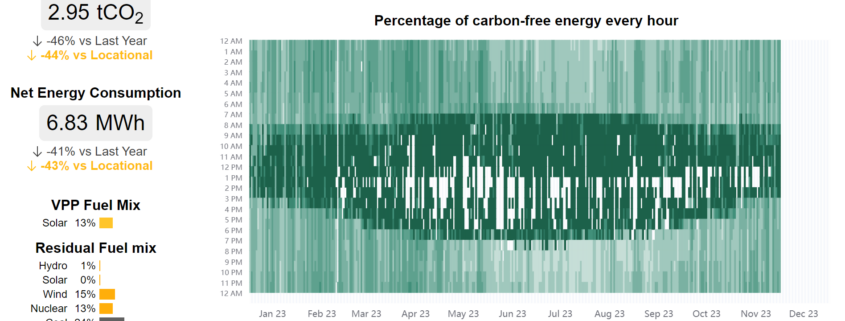
  • 14% more energy used
  • 26% less solar produced (though a much cloudier week)
  • The solar peak for the week was 3.2kW vs the previous week’s 3.6kW
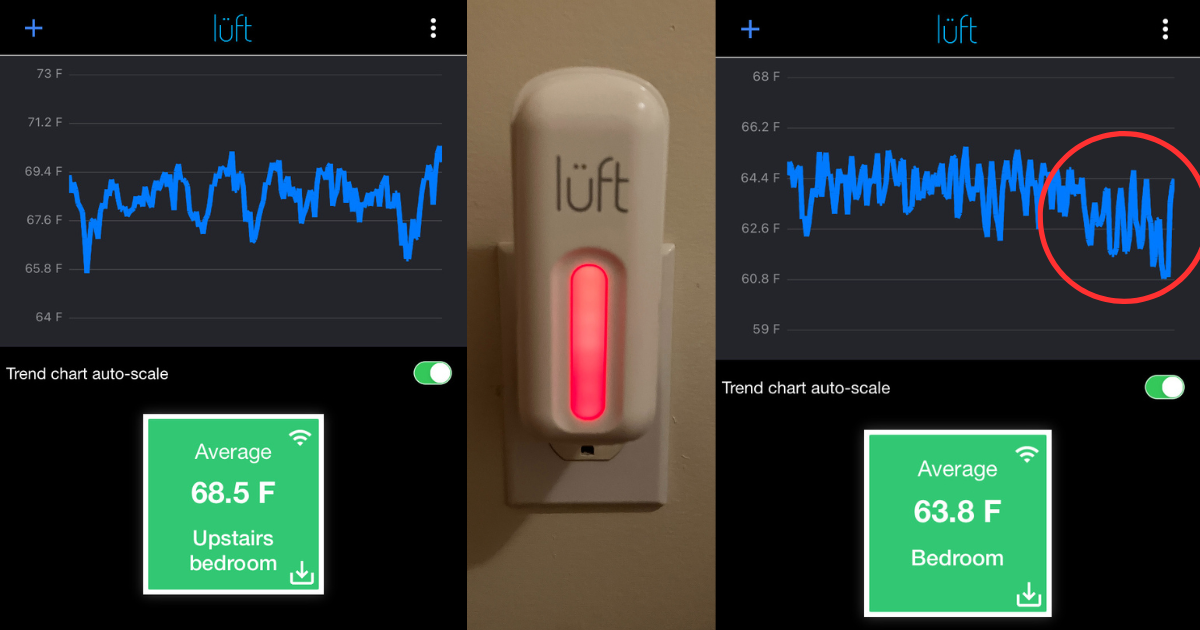
  • Avg Humidity 47% vs 45%
  • Avg Temp 74 vs 72.5
    • Peak temp 79 degrees
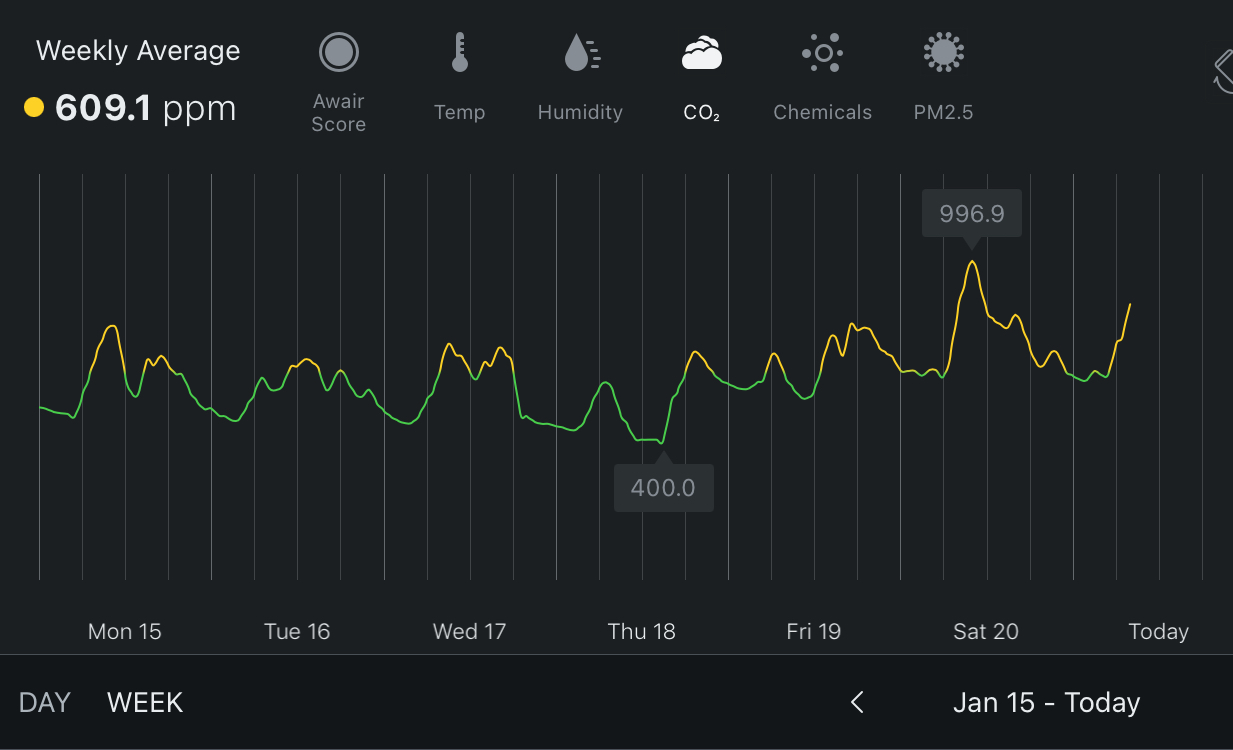
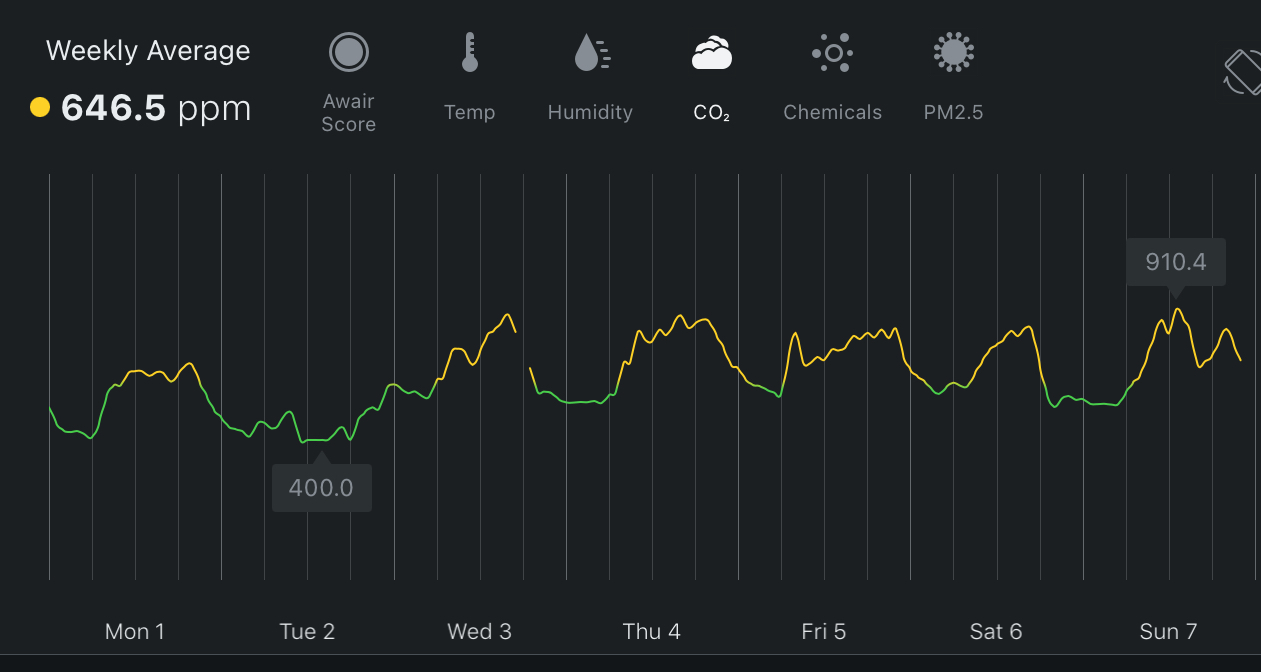
  • CO2 858 ppm vs 620
  • VOCs 759 vs 275
  • Mechanical room / Crawl Dew Point: 46
  • Basement Dew Point: 52
    • Temps went down, but humidity increased in the heatwave compared to the previous week.

Energy usage increases highlights

  • Cooling from the afternoon, sometimes till 1:30 at night
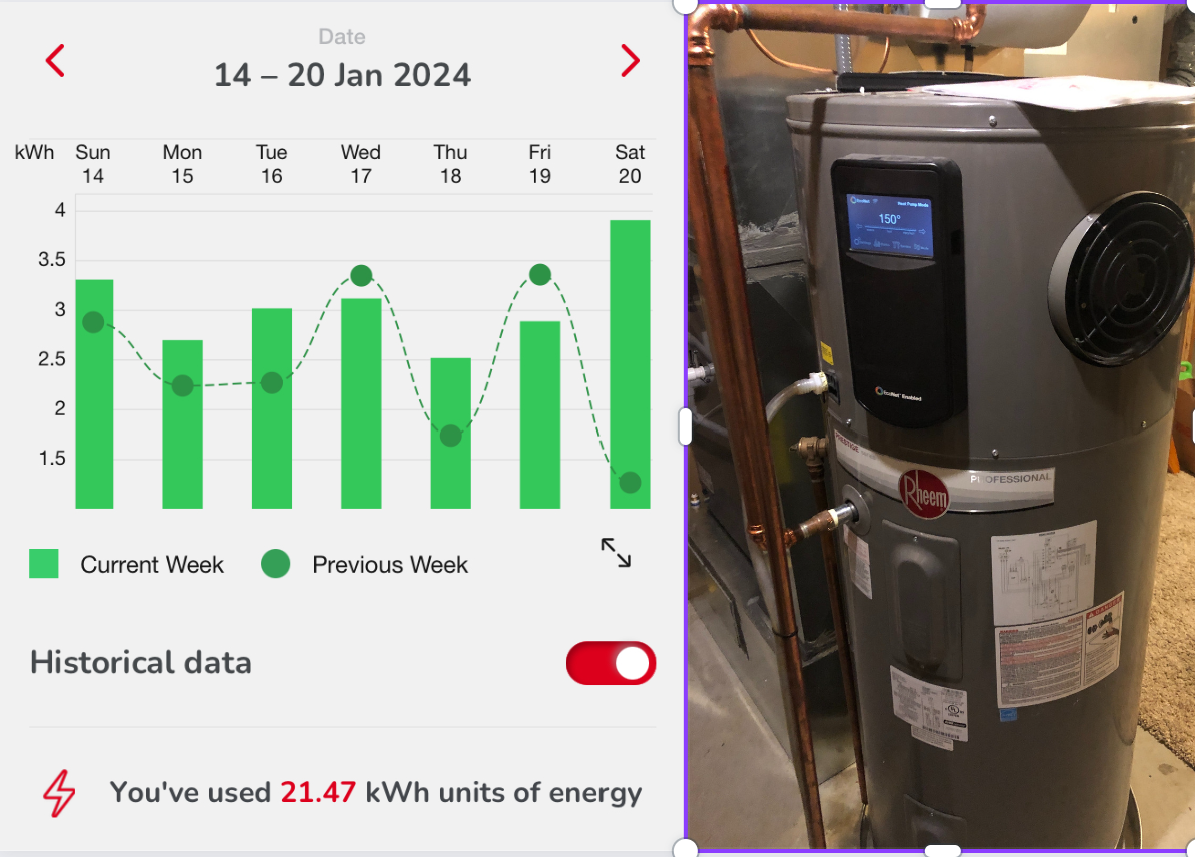
  • The dehumidifier running a little longer from higher humidity
  • Ran bathroom longer through the day

Energy usage decreases highlights

  • Traveled less and stayed in so less car charging
  • Did less cooking on an electric stove to avoid overheating
  • Avoided condensing dryer usage on the last Saturday of the heatwave
  • Shut down the Energy Recovery Ventilator
  • Shut down the recirculating fan when the heat pump was not running.

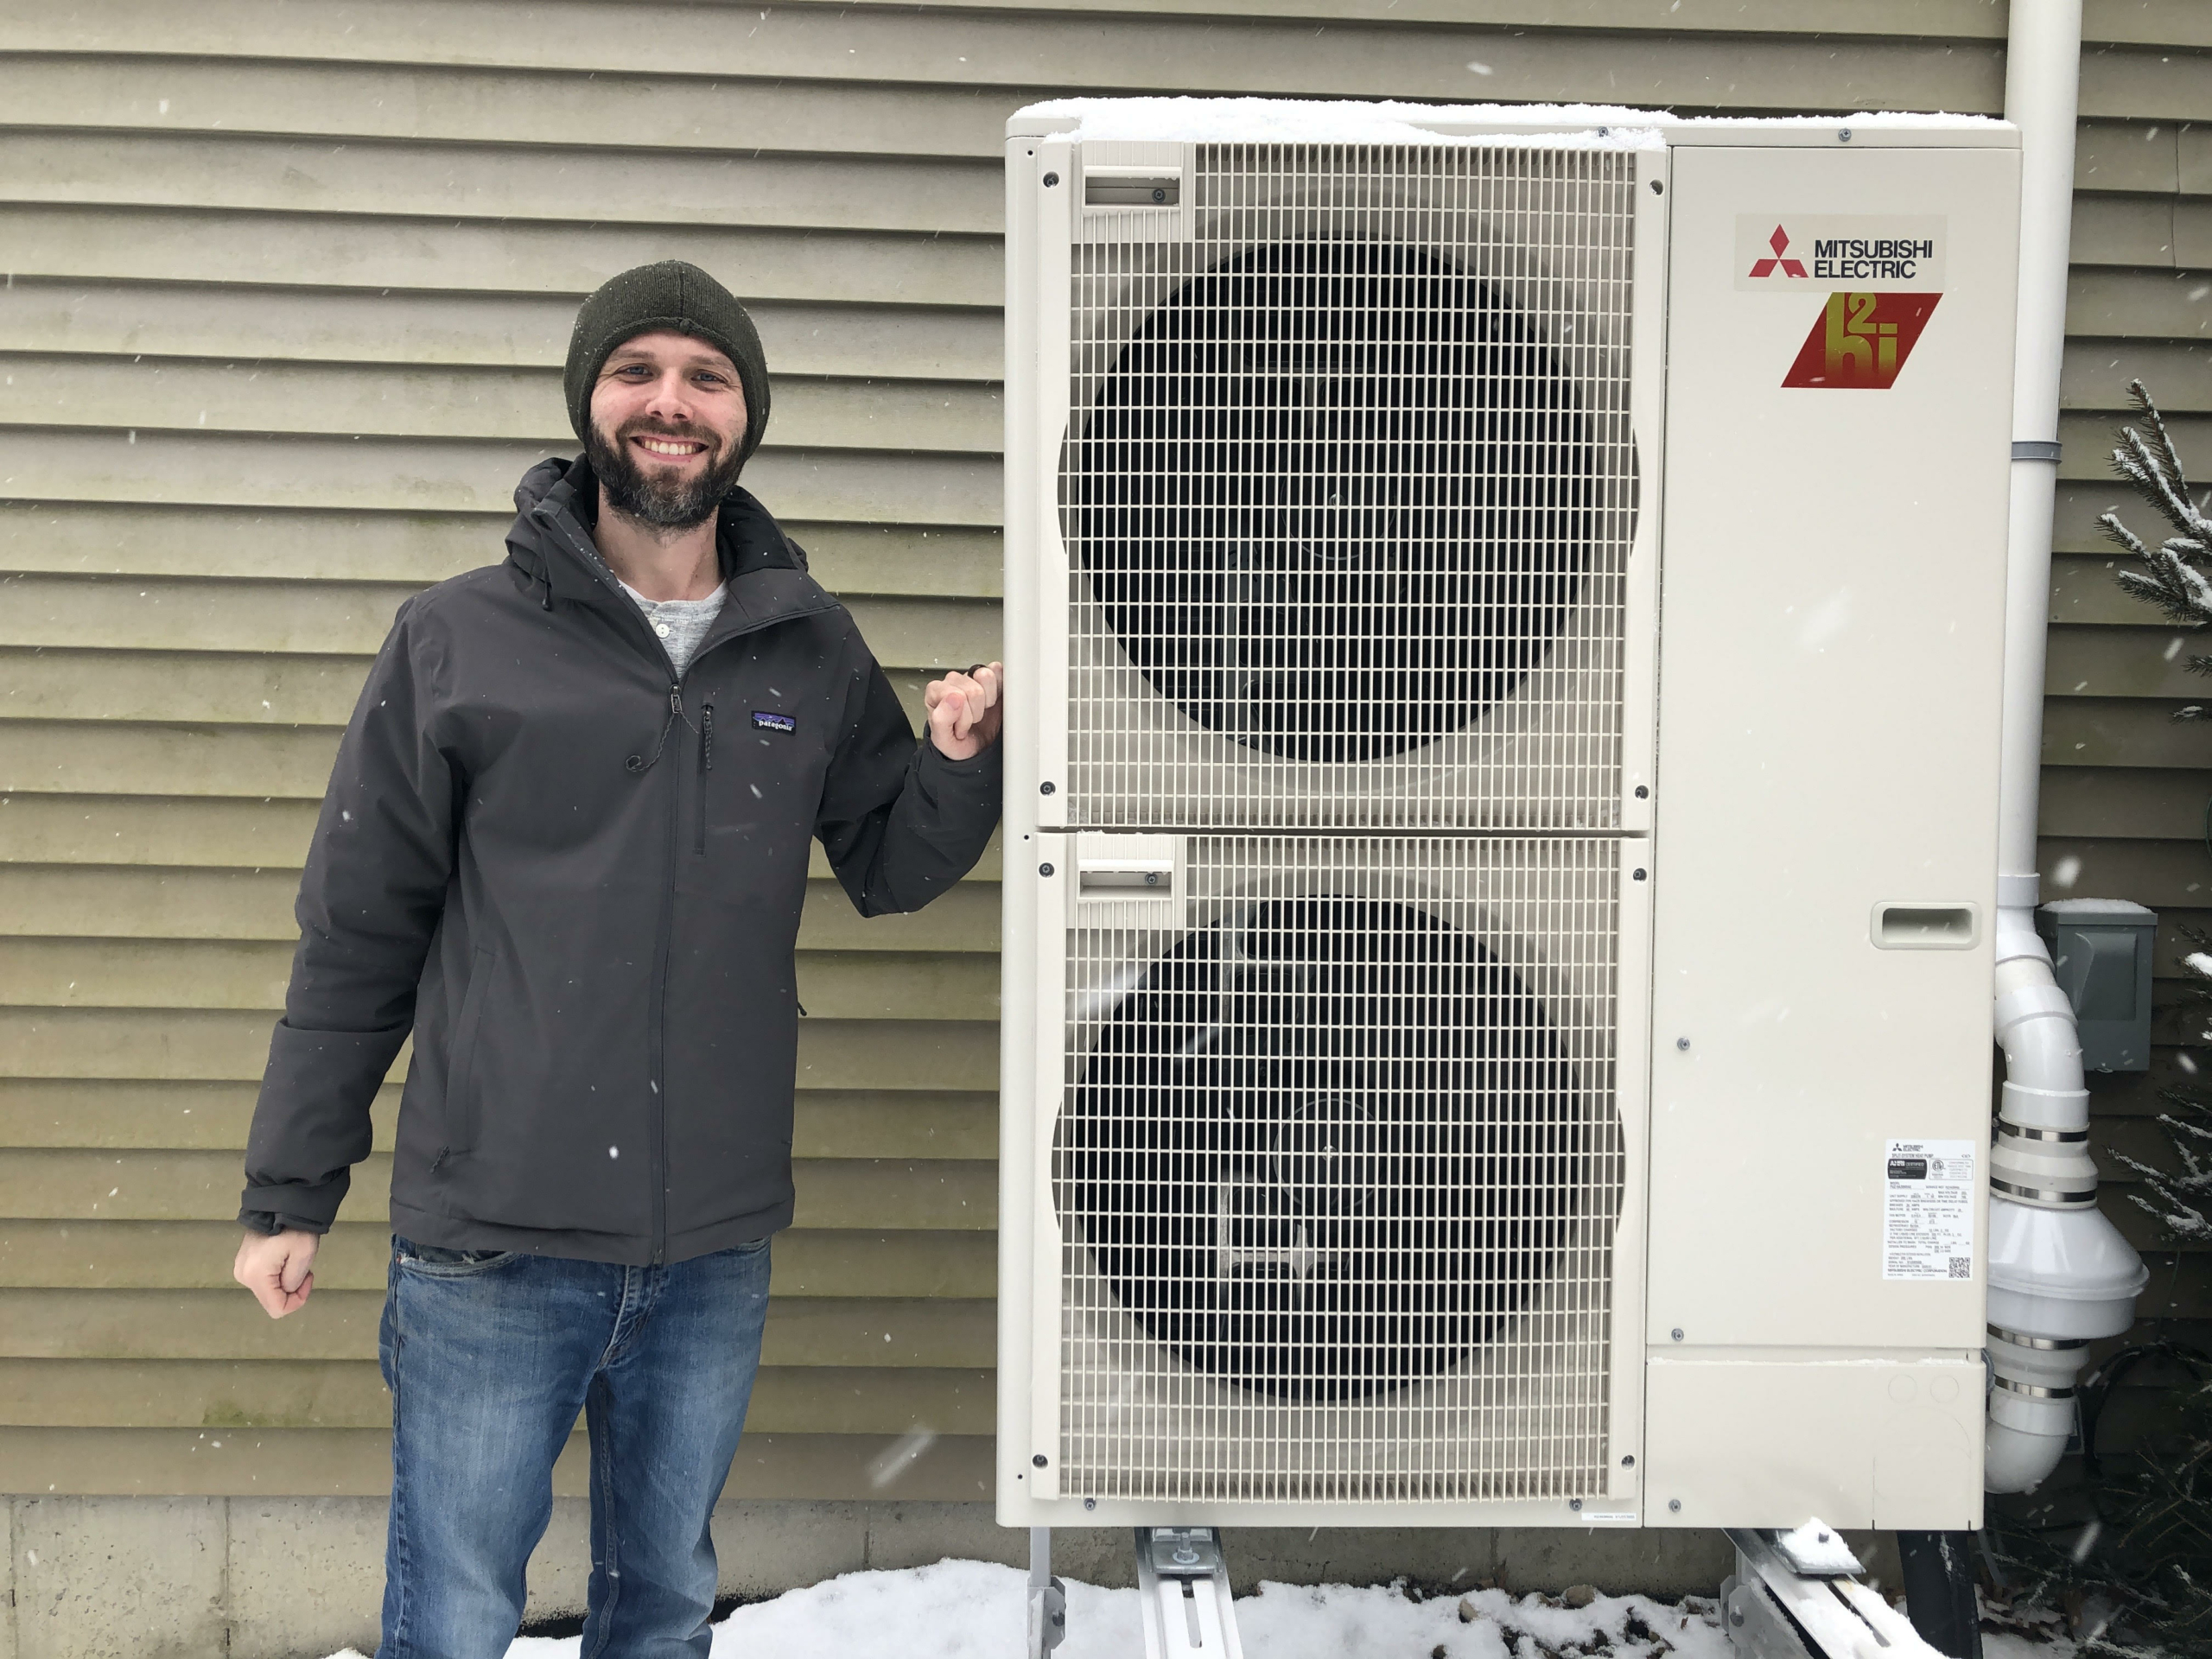
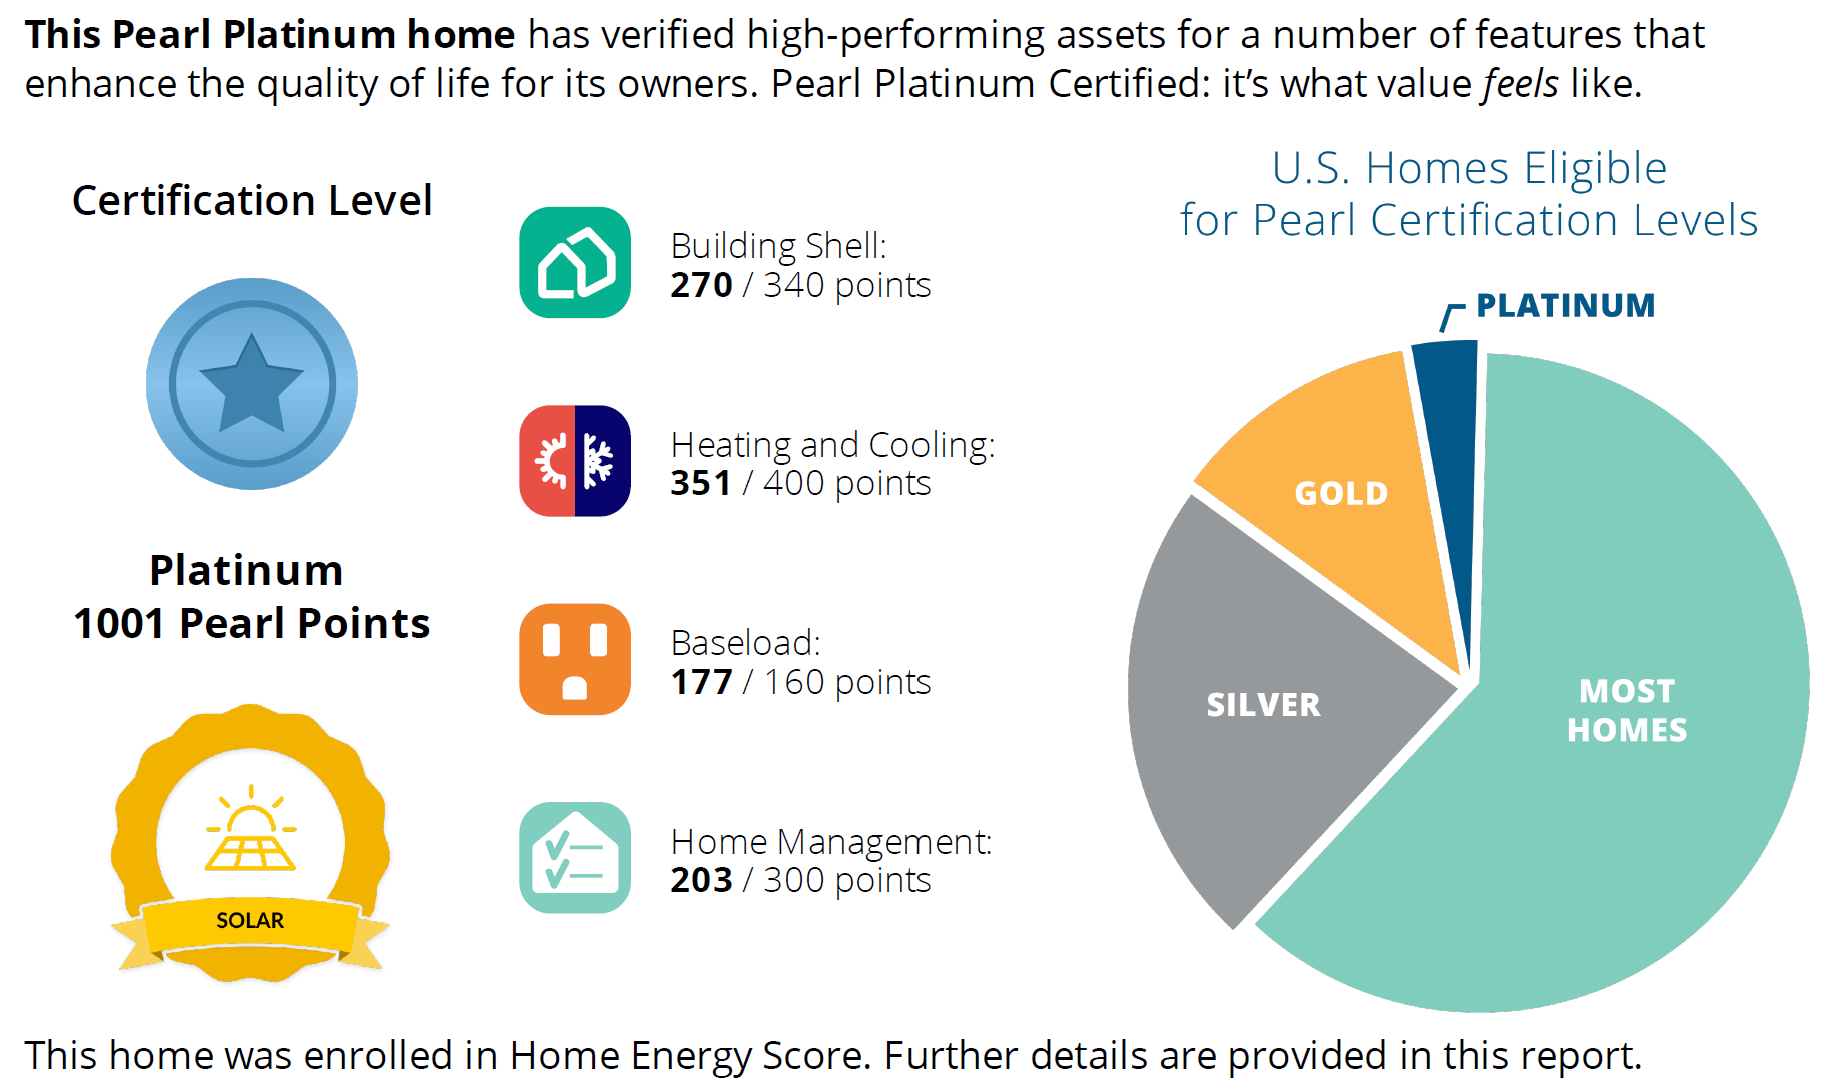
Before reading on, you should get a better sense of my home to help you understand, though it is unnecessary.

So what explains all these numbers, and what was going on?

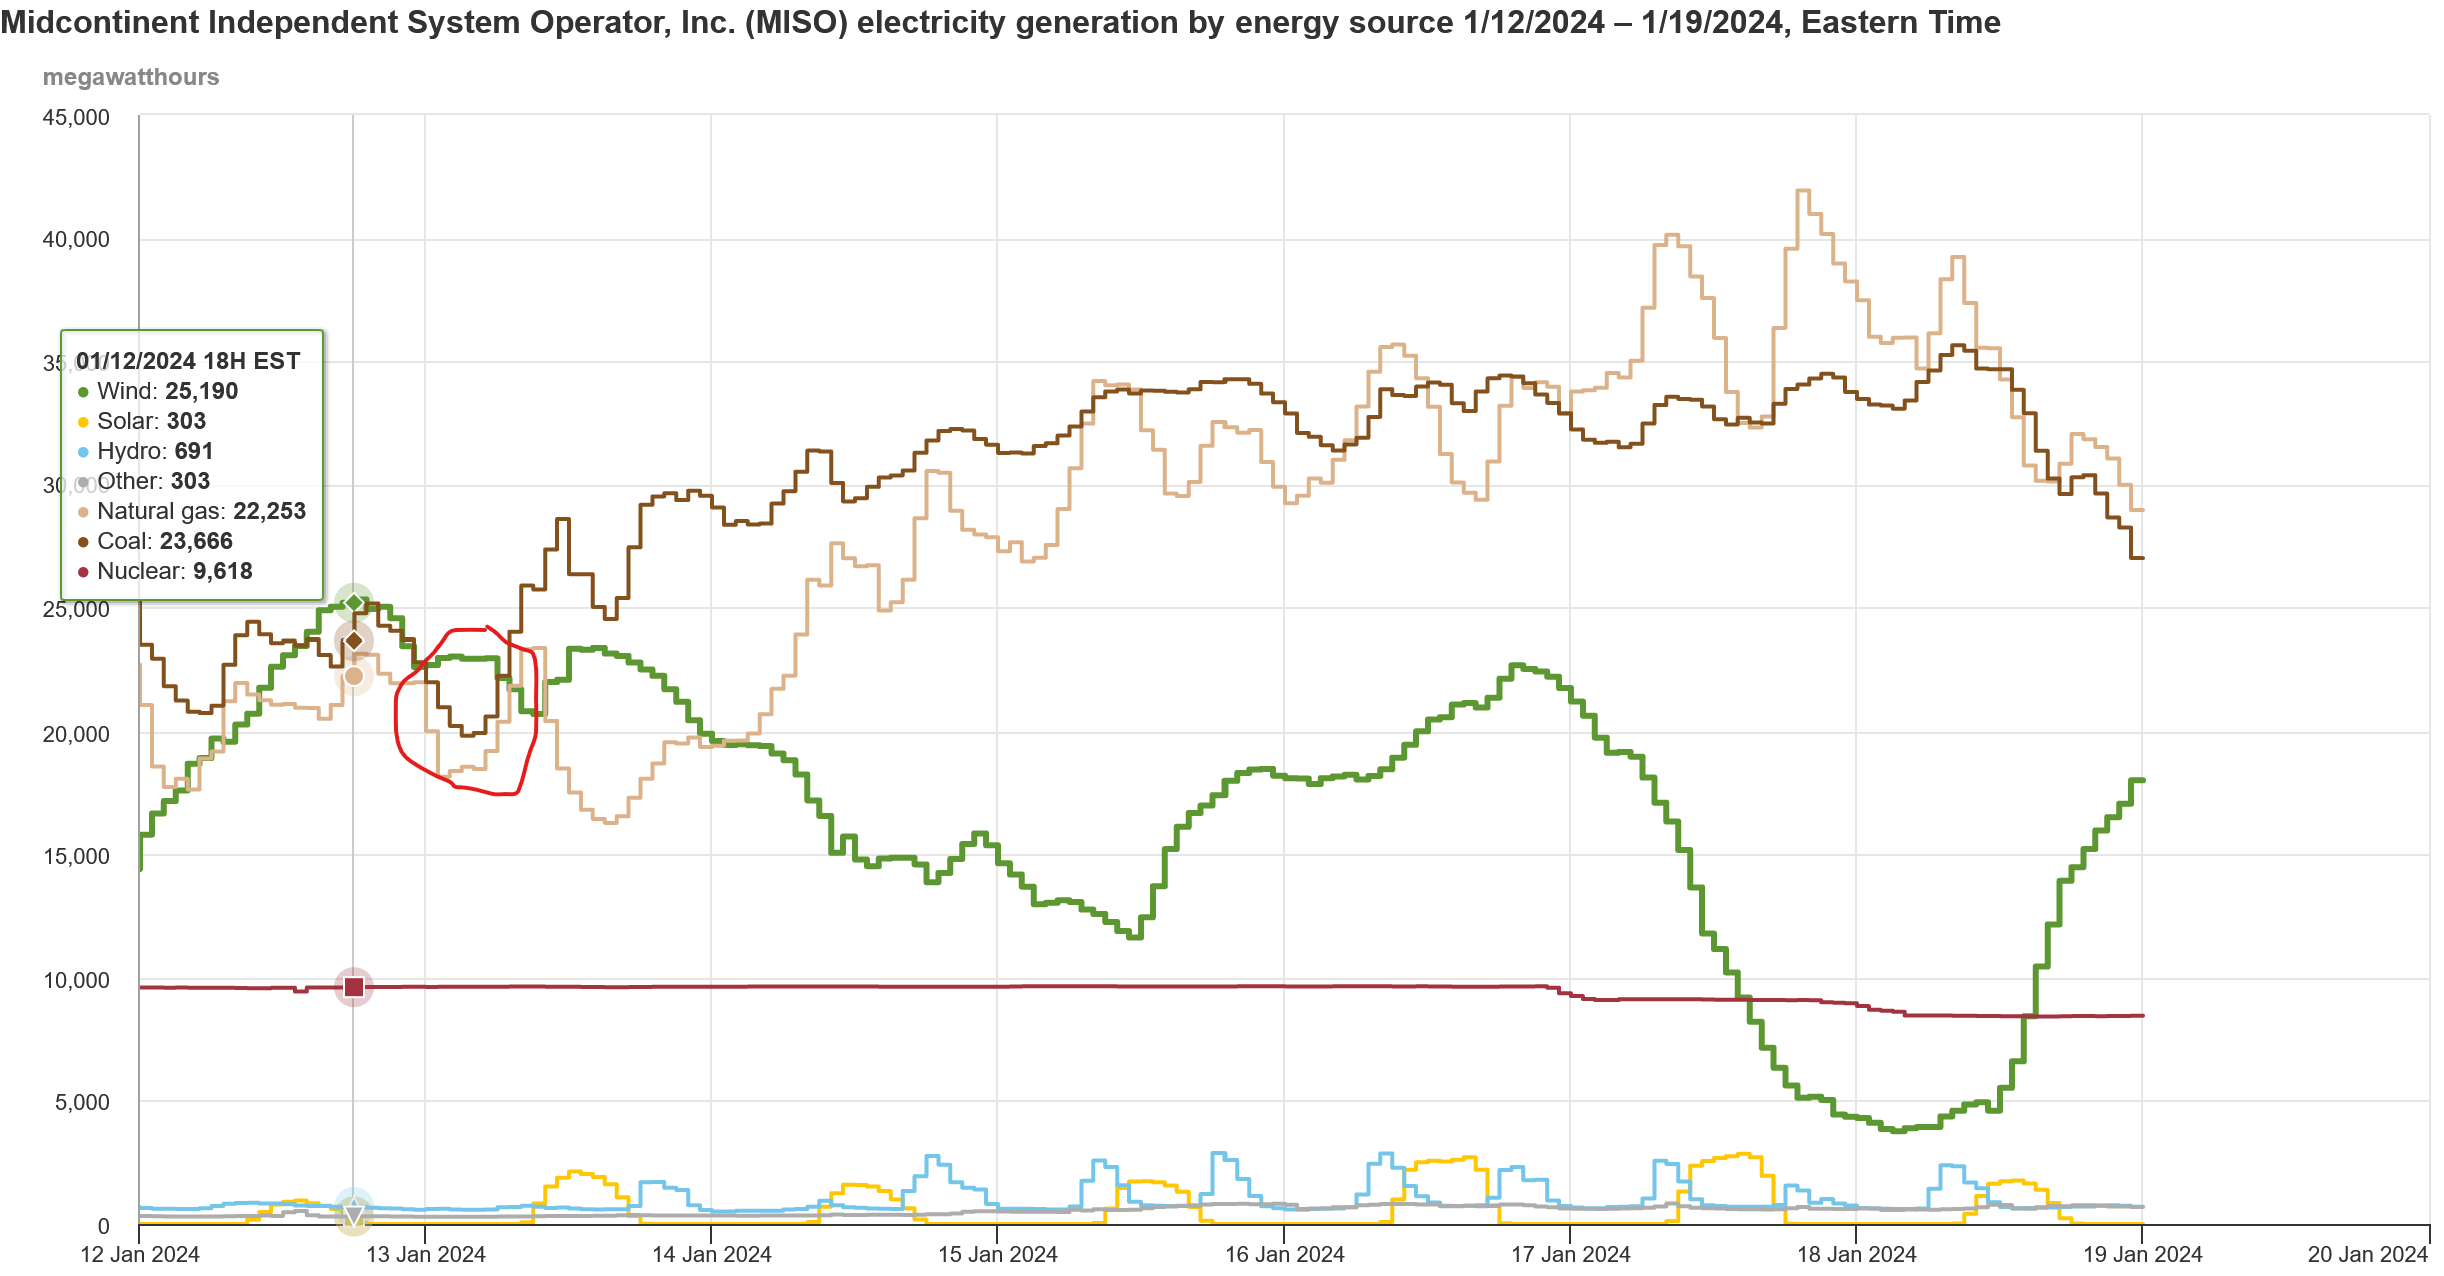
Before the heatwave, I prepared the house by turning down my unducted whole-home dehumidifier in the basement / finished crawlspace to 47 for humidity. That room gets pretty humid, and I am concerned about mold growth, so we are running it dry because it is drying out the entire home. Keeping the humidity low also allowed me to set the heat pump cooling from 72 to 75 degrees and remain fairly comfortable. Keeping it this low means the system runs all the time, adding about .7 kW of load to the house. The other thing I was doing before the heatwave was practicing staying off the 2 – 7 pm peak as I opted into the critical peak pricing program, which means in the event of a utility call to action, rates go way up to $1 a KwH. In exchange, they are 14% cheaper for the rest of the summer as a trade-off. To do this, I had to play an active battery management role. My battery charges up from solar in the day and then runs the house automatically from 2 – 7 while the remaining solar feeds the grid. However, the heat pump usually begins cooling around. 1:30 pm, and that, along with the dehumidifier, uses a lot of energy. So I put a timer on my phone to switch the battery settings from the time of use rate setting to power the entire home setting. What that does is first power the home from solar and send the remaining to the grid. Then, if that is not enough, the battery supplements the solar to ensure I am not using grid power. If there is extra solar energy, it feeds the grid. Then, at 7 pm, I switch the battery back to the time of use mode, which reserves it for the next day, and the extrasolar keeps feeding the home. This manual control is not ideal; no one should set timers on their phone to control their system; there should be a 3rd setting that automates the combination of two features on time of use / and run home off renewables.

In the end, I was surprised yet relieved that our utility company never put out the call for critical peak energy usage because while I managed to keep energy usage off the peak time mostly, I ended up ignoring my phone alert one day to switch the setting by 2 pm which means the battery drained significantly (but I also fed a lot of solar to the grid!) and then that day we decided to cook so by 5 pm I was running a 2.3 Kwh load on average off the grid before I realized it. The battery was set to stop feeding the house once it was 50%; if I had kept the setting lower, it might not have been an issue. Had the utility called a critical, that small amount of energy load during that would have been very expensive, and no, they do pay us extra for sending solar to the grid at peak time either, so that extra to the grid would not have helped me.

The heat pump ran significantly throughout the day, sometimes starting at 10:30 am and going until 1:30 am. The temperature remained fairly comfortable; the set point was 75 degrees; however, a few times, it read up to 79 degrees as the afternoon sun entered our large unshaded windows. Even before the heatwave, the thermostat would get up to 77 degrees for a short period at those times. We may not have accounted for all that extra solar gain when sizing the heat pump. However, when I first got it, I could maintain 72 degrees at the thermostat, and now, holding 75 all the time is not always happening, but it’s better than having an oversized heat pump. I had the heat pump tested and tuned a few weeks prior, so I am looking into this issue. Ultimately, consistent running more to keep the house cool increased our power consumption compared to the previous week but helped keep humidity low.  

The humidity held at a comfortable level, just up to 2% from the previous week’s 47%, and the temperature held on average across multiple air quality monitors at 74 degrees, so for the most part, the house remained comfortable even when the heat pump thermostat read 79. The basement stayed very cool and dry as normal, so it was easy enough to go down there in the height of the afternoon if needed.

Transitioning to air quality, we shut down the recirculating heat pump fan, which I was using to filter the air, but it also increased humidity. We shut down the energy recovery ventilator (ERV) because the filter needed to be changed and cleaned. I did not feel like doing that during that week, but the whole week also brought air quality alerts with high levels of ozone, and none of the furnace filters would filter ozone, so I did not want that coming into the house. Also, ERVs bring additional humidity into homes (though less than other ventilation strategies), but I wanted to avoid that issue during the more humid week. However, in exchange, we ran the bath fan slightly longer to deal with local exhaust and humidity issues near the main living space. Despite all that, indoor CO2 levels were up more than 200 ppm on average, and indoor VOCs were nearly 500 ppm on average. This was partly because the ERV was shut down, the hotter sun was hitting the windows and causing afternoon VOC spikes, and because we stayed inside and did not leave as much that week due to the heatwave.  

In the end, I am very grateful for having a newer home built well and for this technology, which helps keep my family cool and comfortable while staying off the peak energy use times, reducing significant carbon emissions.

Our team at the GreenHome Institute, through our West Michigan Green Affordable Housing work, has seen many homes with poor insulation; they are very leaky and have inefficient A/C (or none!) A/C and certainly no way to reduce energy usage during peak times. There is a lot of need to help ensure people are safe and comfortable, have affordable energy bills, keep carbon emissions low, and ensure the grid is not overloaded. We can all achieve that goal of helping our housing stock and people.

GHI Education Manager stays warm in cold snap using heat out of the air 

The cold snap here in West Michigan is finally subsiding after nearly a week, and I am excited about another year we made it through with just pulling heat out of the air outside to heat our home and keep it cozy. This was despite us being 15 degrees below normal. 

Temps throughout the day averaged in the teens, with some highs in the low 20s and the lowest low at negative 3. The historical average for our region is 30-degree highs and 17-degree lows. 

Using a Mitsubishi Cold Weather Climate Air Source Heat Pump, we kept our comfortable 68-degree set point temp throughout the cold snap without any backup resistance heat or backup methane gas. 

This is now our 3rd winter being a heat pump compared to a traditional methane gas furnace, and it has worked great because we are fortunate to have an energy-efficient home, and the system was sized, installed, and commissioned appropriately. It keeps the home very comfortable throughout the day and night. 

Using our Sun Radon air quality monitor plugged into the adjacent bedroom, you can see our data use over the last week with an average of 68.5 degrees. Still, if you drill down to 5-minute intervals, there is a lot of variation in the temperature, as one would suspect, ranging from 65 to 70 degrees. 

Beyond comfort, I wanted to look at energy use for the week, so I looked back at 2021 to find an average temperature in the same period. Looking at Jan 13 – 20th, 2021, I noted I used 76 kWh daily vs. 80 this year. Also, during that time, I did not own an electric car, nor did I have a whole home dehumidifier running, so the reality is counting for those loads; this cold snap did not add any additional energy load on the house. 

I wanted to focus on Jan 16 this year, the day I used the most power, the coldest average during the cold snap of about 12 degrees. I want to see how much power came from the heat pump vs. everything else. During that day, we used 91 kWh of power. 5.5 came from car charging, and 2.3 came from the heat pump water heater (more on that later). We average 16 kWh a day in the home throughout the year without heating and cooling, meaning about 60 kWh of power, or 65% of our power, was used to heat this house that day. Update – Edward Louie PNNL Pointed out too – “Another important thing is you never exceed 10 kW and often never even exceed 5 kW. Electrification of everything using heat pumps results in very low peak loads even on a cold day. And also it shows how the need for a 200A service to do full electrification is rarely actually needed. In your home a 100A service would be way more than enough even when accounting for factor of safety.”

I also like to look at where that power comes from; using the MISO EIA data, I can see my local grid’s power and energy sources powering my house and heat pump. As the storm picked up on Jan 12, at one point, you can see Wind power surpassed coal and natural gas briefly, and then wind stayed a pretty good mix on the grid thoughout much of the storm, helping ensure I consumed more carbon-free power to heat my home vs. if I was just using 100% methane gas (furnace), it would all be emissions. 

I also use a RHEEM gen 3 Heat Pump Water Heater, which works great during a cold snap; since we were all home more, we used more hot water and never had an issue. You can see in this chart that the week used 21 kWh of power, which was not any more than the previous weeks. The device works by taking the heat out of my utility room, so their energy comes from the heated energy in the house, so you need to be mindful of these devices.

Looking at my Sun Radon data here again, I looked at this graph and noted that from Dec to mid-January, the adjacent room averaged nearly 64 degrees, but during the cold snap, it dropped to 62 degrees. This is in part directly related to the heat pump water heater. Still, the home’s existing ductwork has panned ductwork into the joists and hidden behind drywall. Meaning my home distribution system could be better. So air delivered to the basement or living room will be off the temperature set point, which I notice is sometimes off by 10 degrees. To fix this issue, I could blow in an air sealant into the ducts or, better but more expensive, could redo all the ductwork, which would require tearing out all the drywall, which is in good shape. Poor air delivery is sometimes why people use mini-splits to heat and cool rooms that the existing ductwork does not reach well. In my case, the room adjacent to the utility room is used sparingly, but these are things to consider when considering your systems and how they work with the existing home and your budget. 

What about getting fresh air and good ventilation in the cold?

I also looked at our energy recovery ventilator (ERV) and the fresh air it brings in. Most ERVs freeze up when they get cold, but my Panasonic Intellibalance ERV can operate down to -22 before the defrost cycle kicks in. One easy way to know if it is working is to look at carbon dioxide levels in the home. Two weeks previously, we were all here for Christmas break, and it was much warmer than this week when we were here due to the storms, but it was cold. You can see little difference in the CO2 levels, but we maintain our targeted levels. Keeping CO2 low helps improve performance; since I work from home, it helps improve sleep quality. 

Despite this cold snap, the reality is, overall, it is getting warmer; in December, we have some record-breaking heat here, and one side benefit of this is it makes our colder climate more conducive for heat pumps as we can expect to see much warmer temps, keeping energy costs lower for heat pumps. However, we will still experience extreme cold temps, likely record-breaking at times, and so having a versatile cold weather climate heat pump properly designed, installed, commissioned, and maintained within a home that is air sealed and insulated well is a great way to switch to healthier and comfortable heating that can reduce carbon emissions.  

New Inflation Reduction Act Tax Credits & Rebates can also help fund these systems up to $8,000 and help you get an inspection to determine their feasibility. You can learn more about that here.

Want to learn more about heat pump technology? Here is a great article with nice visuals that just came out from the Guardian.  

Learn more about my green home renovation and how you and your clients can. 

GHI education manager reduced energy and carbon emissions down 40%+ in 2023

This year, my family’s energy use is down 41% from last year, and carbon emissions were down 46% from 2022, but we only saved $100 due to the high inflation of energy costs.

We produced almost 4,500 kWhs of solar, up 200 kWhs from 2022 from our south-facing 3.96 Panasonic solar installed by The Green Panel

The solar to battery allows me to be 99% off the summer 2 – 7 peak and send 66% of our summer solar to the grid during peak when it is needed most.

Our energy use was down this year for two main reasons, though not related to solar power.

First, we installed a whole home dehumidifier in the basement/crawl space in the summer of 2022, and it ran full-time through the fall to get out excess humidity. Then it switches to demand control only and has not run as much this year. It shows how much energy it takes to dehumidify when homes are built or renovated to reduce humidity right from the start.

Next, using degree days.net, I determined it was a fluke year, which was cooler in the summer (71 less CDD) and warmer in the winter, fall, and spring (800+ less HDD!), significantly cutting heating and cooling down.

My house is all-electric, run by an air source heat pump, and most of my travel is on an electric portion of a volt, though there is still some gas usage for travel. So, some carbon is not accounted for here from the use of fossil gas travel; however, most people do not report emissions from travel when reporting home emissions. Something that will be important to account for as total emissions in the future.

The WattCarbon tool here is free to use and one of my favorite ways to visualize energy use and associated carbon emissions by year, month, day, and hour! I could even purchase Energy Attribute Certificates (EACs) from them to go zero carbon https://app.wattcarbon.com/marketplace/

Here are more details on my project and how you can too! 
https://greenhomeinstitute.org/little-residence-pearl-platinum-aiming-for-greenstar-zero-carbon/

GHI Education Manager picks up PEARL Platinum / Electric Home Badge. Details solar value.

I am thrilled to announce my house’s (re)certification to the Pearl Platinum standard!

I was also recently able to pick up the all-electric home badge and look at the solar equity calculator to properly value my home with solar.

I am very grateful to Casey Murphy and his team there for assisting with this, and actually, I’ve been certified for two years now, but just finally getting the word out now.

I am excited about Pearl certification and why I want to get the word out. Here are three reasons why.

The first is Pearl is a great stepping stone to call GreenStar Home Certification in much the same way energy star is the energy baseline to LEED Residential. Pearl is a great energy efficiency program that can serve as a baseline so all homes and a starting point for green. A Gold Pearl Certified level meets the baseline requirements of GreenStar Homes Certification.

Next, all homes need continual improvement and maintenance, and their Green Door program offers homeowners or landlords ways to maintain their homes and make upgrades to achieve higher levels of pearl, home health, and comfort. Making sure the home is well maintained and is an easy hand-off to the next owner. In connection again with GreenStar, the silver requirements are that the owners have an operations manual, and this green door tool covers more than that.

Finally, as I mentioned, the solar equity calculator has proven to help appraisers understand how to value solar properly, which is one of the biggest impediments to solar that I hear often. The complaint is that people who decide they might sell not only think they won’t get any value for the solar but worse, they think the home might not sell or have less value due to solar, which is completely untrue.

Because of Pearl, I was able to eek out 3% more value on my home appraisal from solar. So I am excited to get the word out about the solar equity calculator and provide you with more details on how it works and my reports as well. The solar equity calculator uses a discounted cash flow method to estimate the solar projection, the cost savings based on utility costs, including inflation, and a low, medium, and high estimation of the system value based on its likely energy generation value.

The bottom line is that Pearl + GreenStar Homes + Solar is a win-win for high-performance homes, ensuring home equity and value are communicated well.

You can learn more about the features of my home that helped it meet Pearl here and the details of my solar equity calculator.

My hope you and your clients do this too!